Informing the election
Miles Fletcher reveals how ONS expertise helped the UK’s national news broadcasters to make their election coverage data-rich and statistically accurate.
“A general election is an especially busy time for the ONS media team. As polling day approaches the hunger of the national news machine for the facts and figures around the key issues grows ever greater. Our job is to get the answers to the journalists fast.
Often we’ve found ourselves dealing with multiple questions on different topics from the same organisation. That prompted the suggestion that some of the bigger media players might benefit from having an ONS person of their own on tap.
So for the 2015 election we experimented by loaning a senior statistician to BBC News. The outcome was encouraging. He experienced working in the public eye under brutal deadlines and the broadcasters benefited from the specialist expertise.
This year’s snap election allowed us – at very short notice – to expand the scheme. Three experienced ONS colleagues spent the entire campaign embedded with the production teams at three of the UK’s main network news organisations.
All of our national television news broadcasters are required to be politically impartial. As an independent public body with a mission to bring its statistics and analysis to the widest possible audience, they make perfect partners for ONS. The biggest winners, we trust, were the viewers and listeners.”
Here’s how the three got on….
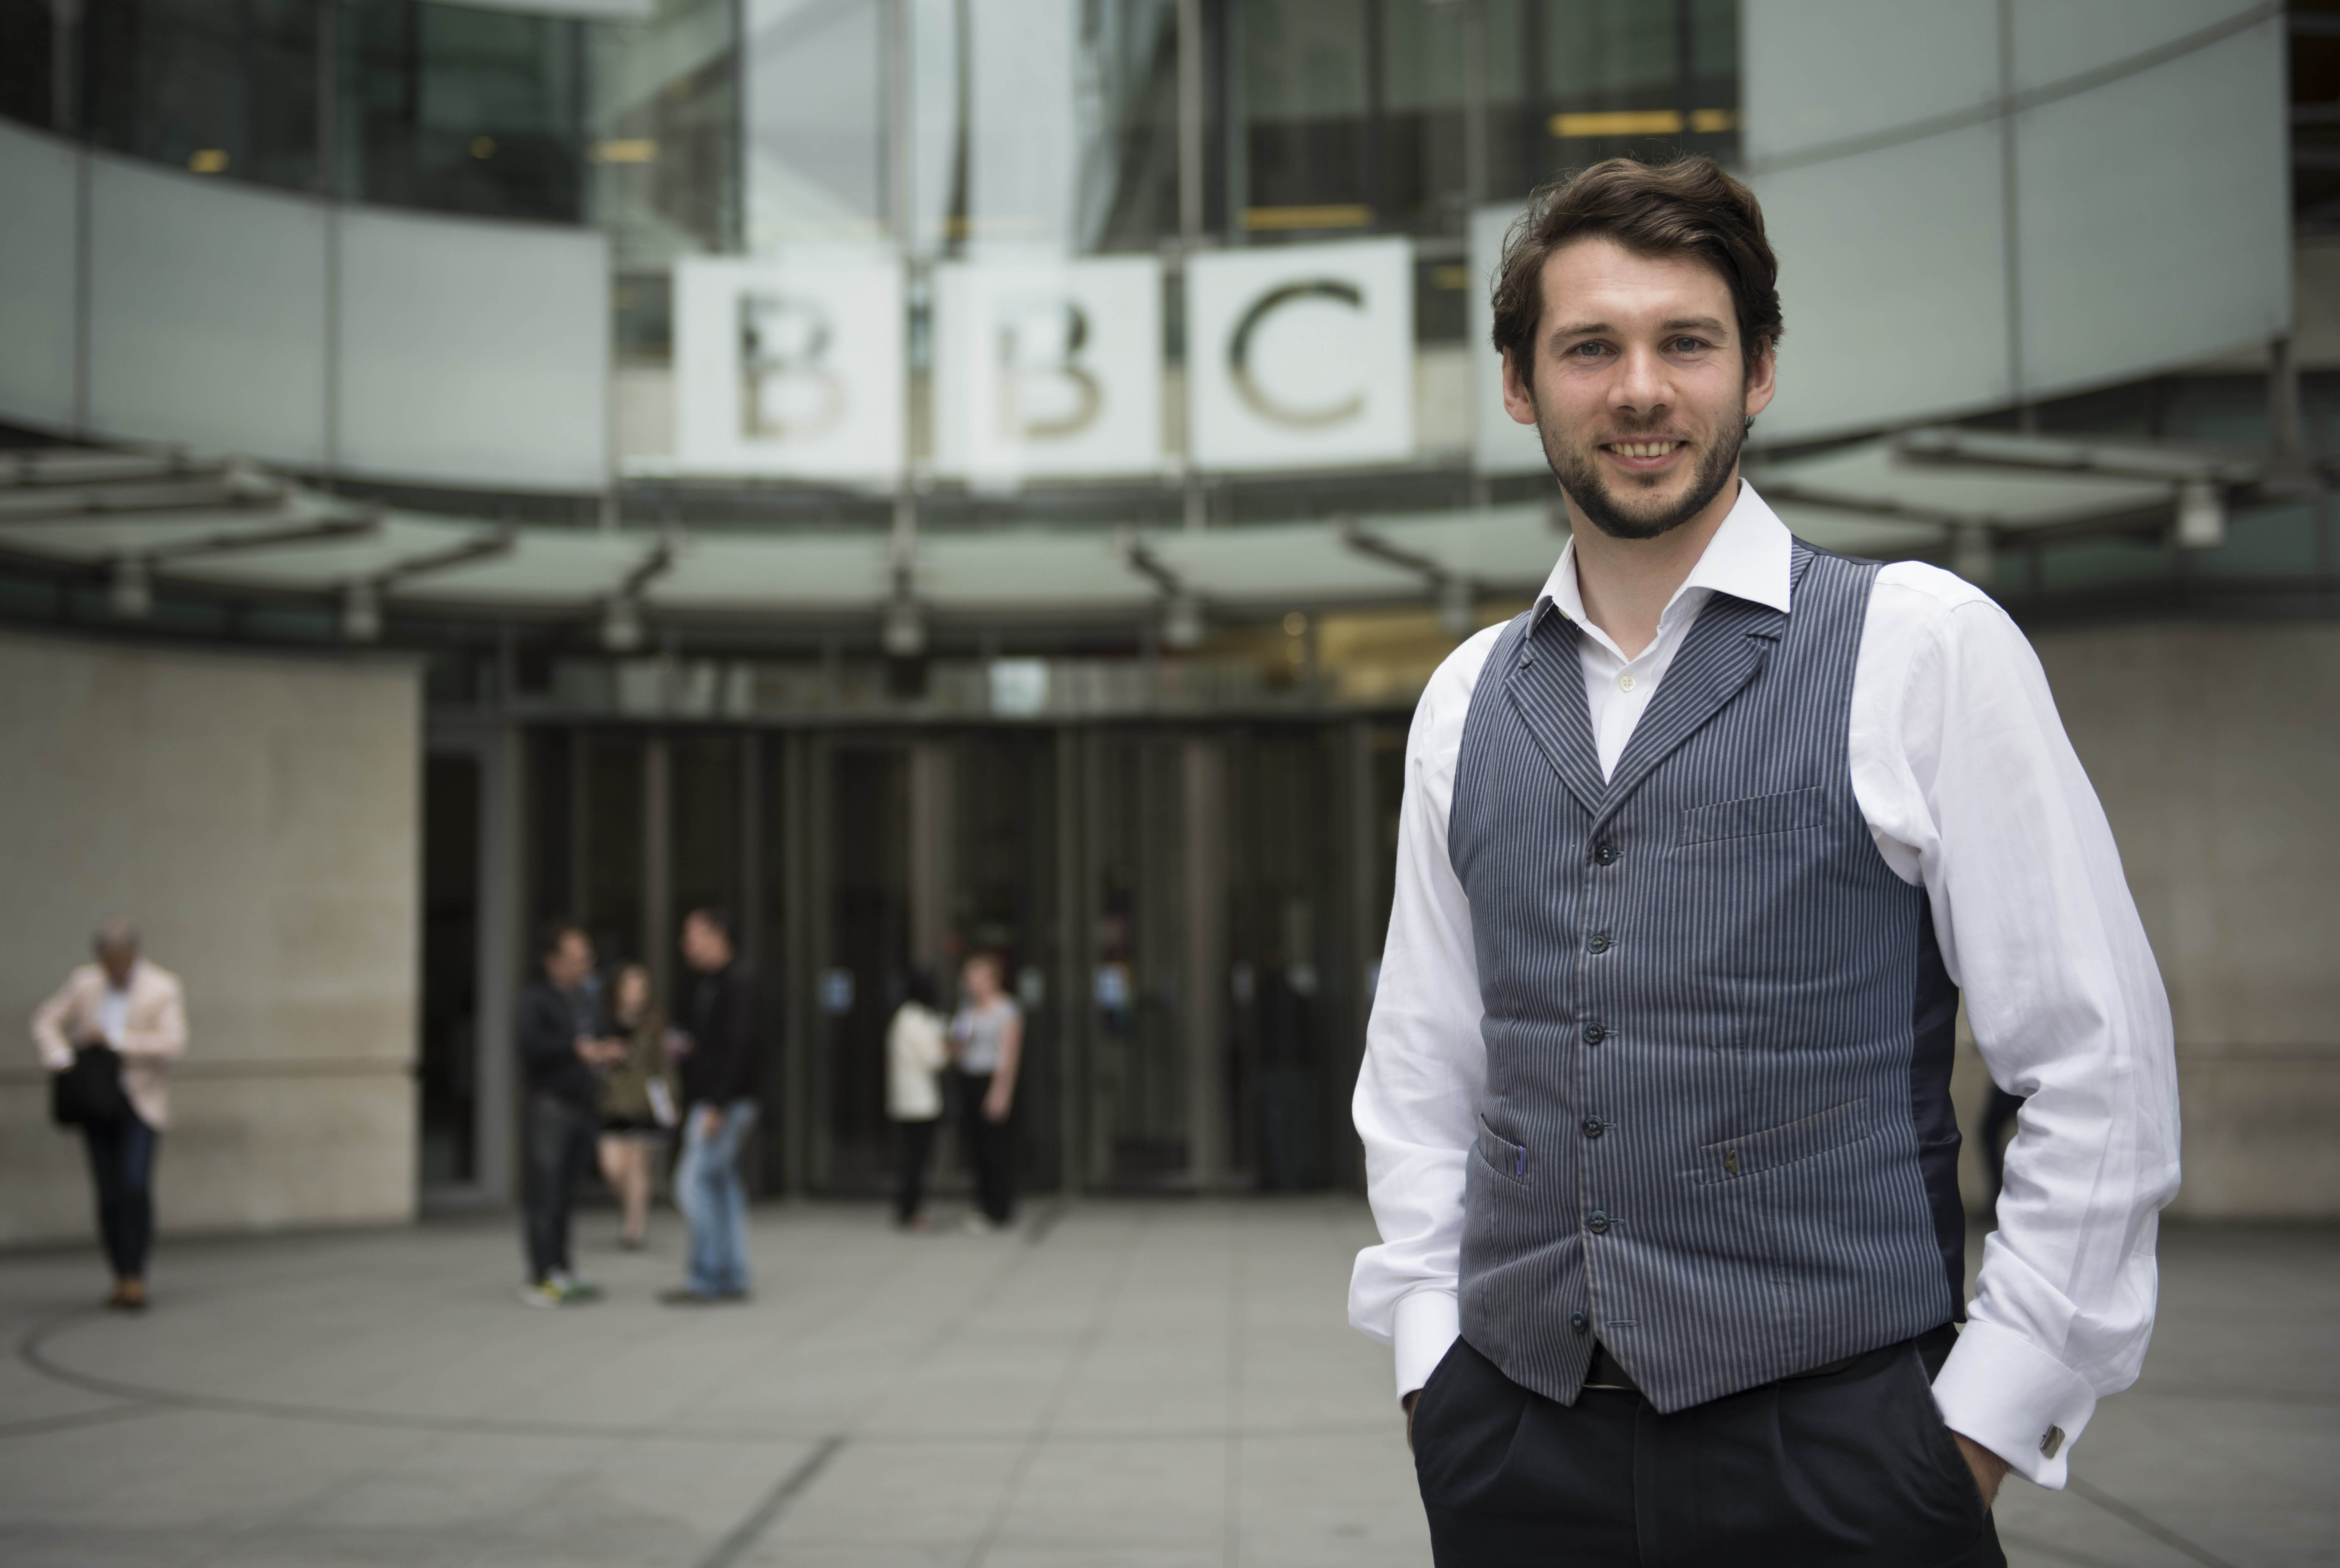
Tom Sadler, Senior Research Analyst attached to BBC News
“I worked primarily with the BBC Visual Journalism and Reality Check teams and also the writers of More or Less, the statistical show on BBC Radio Four. Most of my work involved looking up and interpreting official statistics for journalists.
In journalism, rapidly turning a story around and publishing fast are very important. After all, it’s called news, not ‘olds’.
My knowledge of ONS publications and data sets allowed me to find information on new stories very quickly, and this meant the journalists I was working with could include more statistics in stories that needed to be published quickly. Without my knowledge these stories wouldn’t have had so much information in them.
I also did some more in-depth pieces of data modelling, using my skills to produce stories that otherwise would not have been able to have been published. For example I used demographic information to inform stories about the effects of the voting intentions and turnout rates of young voters.
Both of these ways of working allowed greater exposure and use of ONS statistics.
It was similar to answering Parliamentary Questions and Freedom of Information requests, which most civil servants will have done at some point in their careers, although in most posts we don’t have to answer them every day for five weeks.
I learnt a lot about the needs of journalists whilst at the BBC, who are some of the main users of ONS publications, and help interpret our statistics to a much wider audience.
With the editorial pressure to turn around a story quickly, journalists are much more likely to use a statistical source if it’s clear, well presented and easy for them to use. If it’s filled with jargon, requires prior knowledge or requires a lot of time to understand they will probably leave it, and just publish a story with less data.”
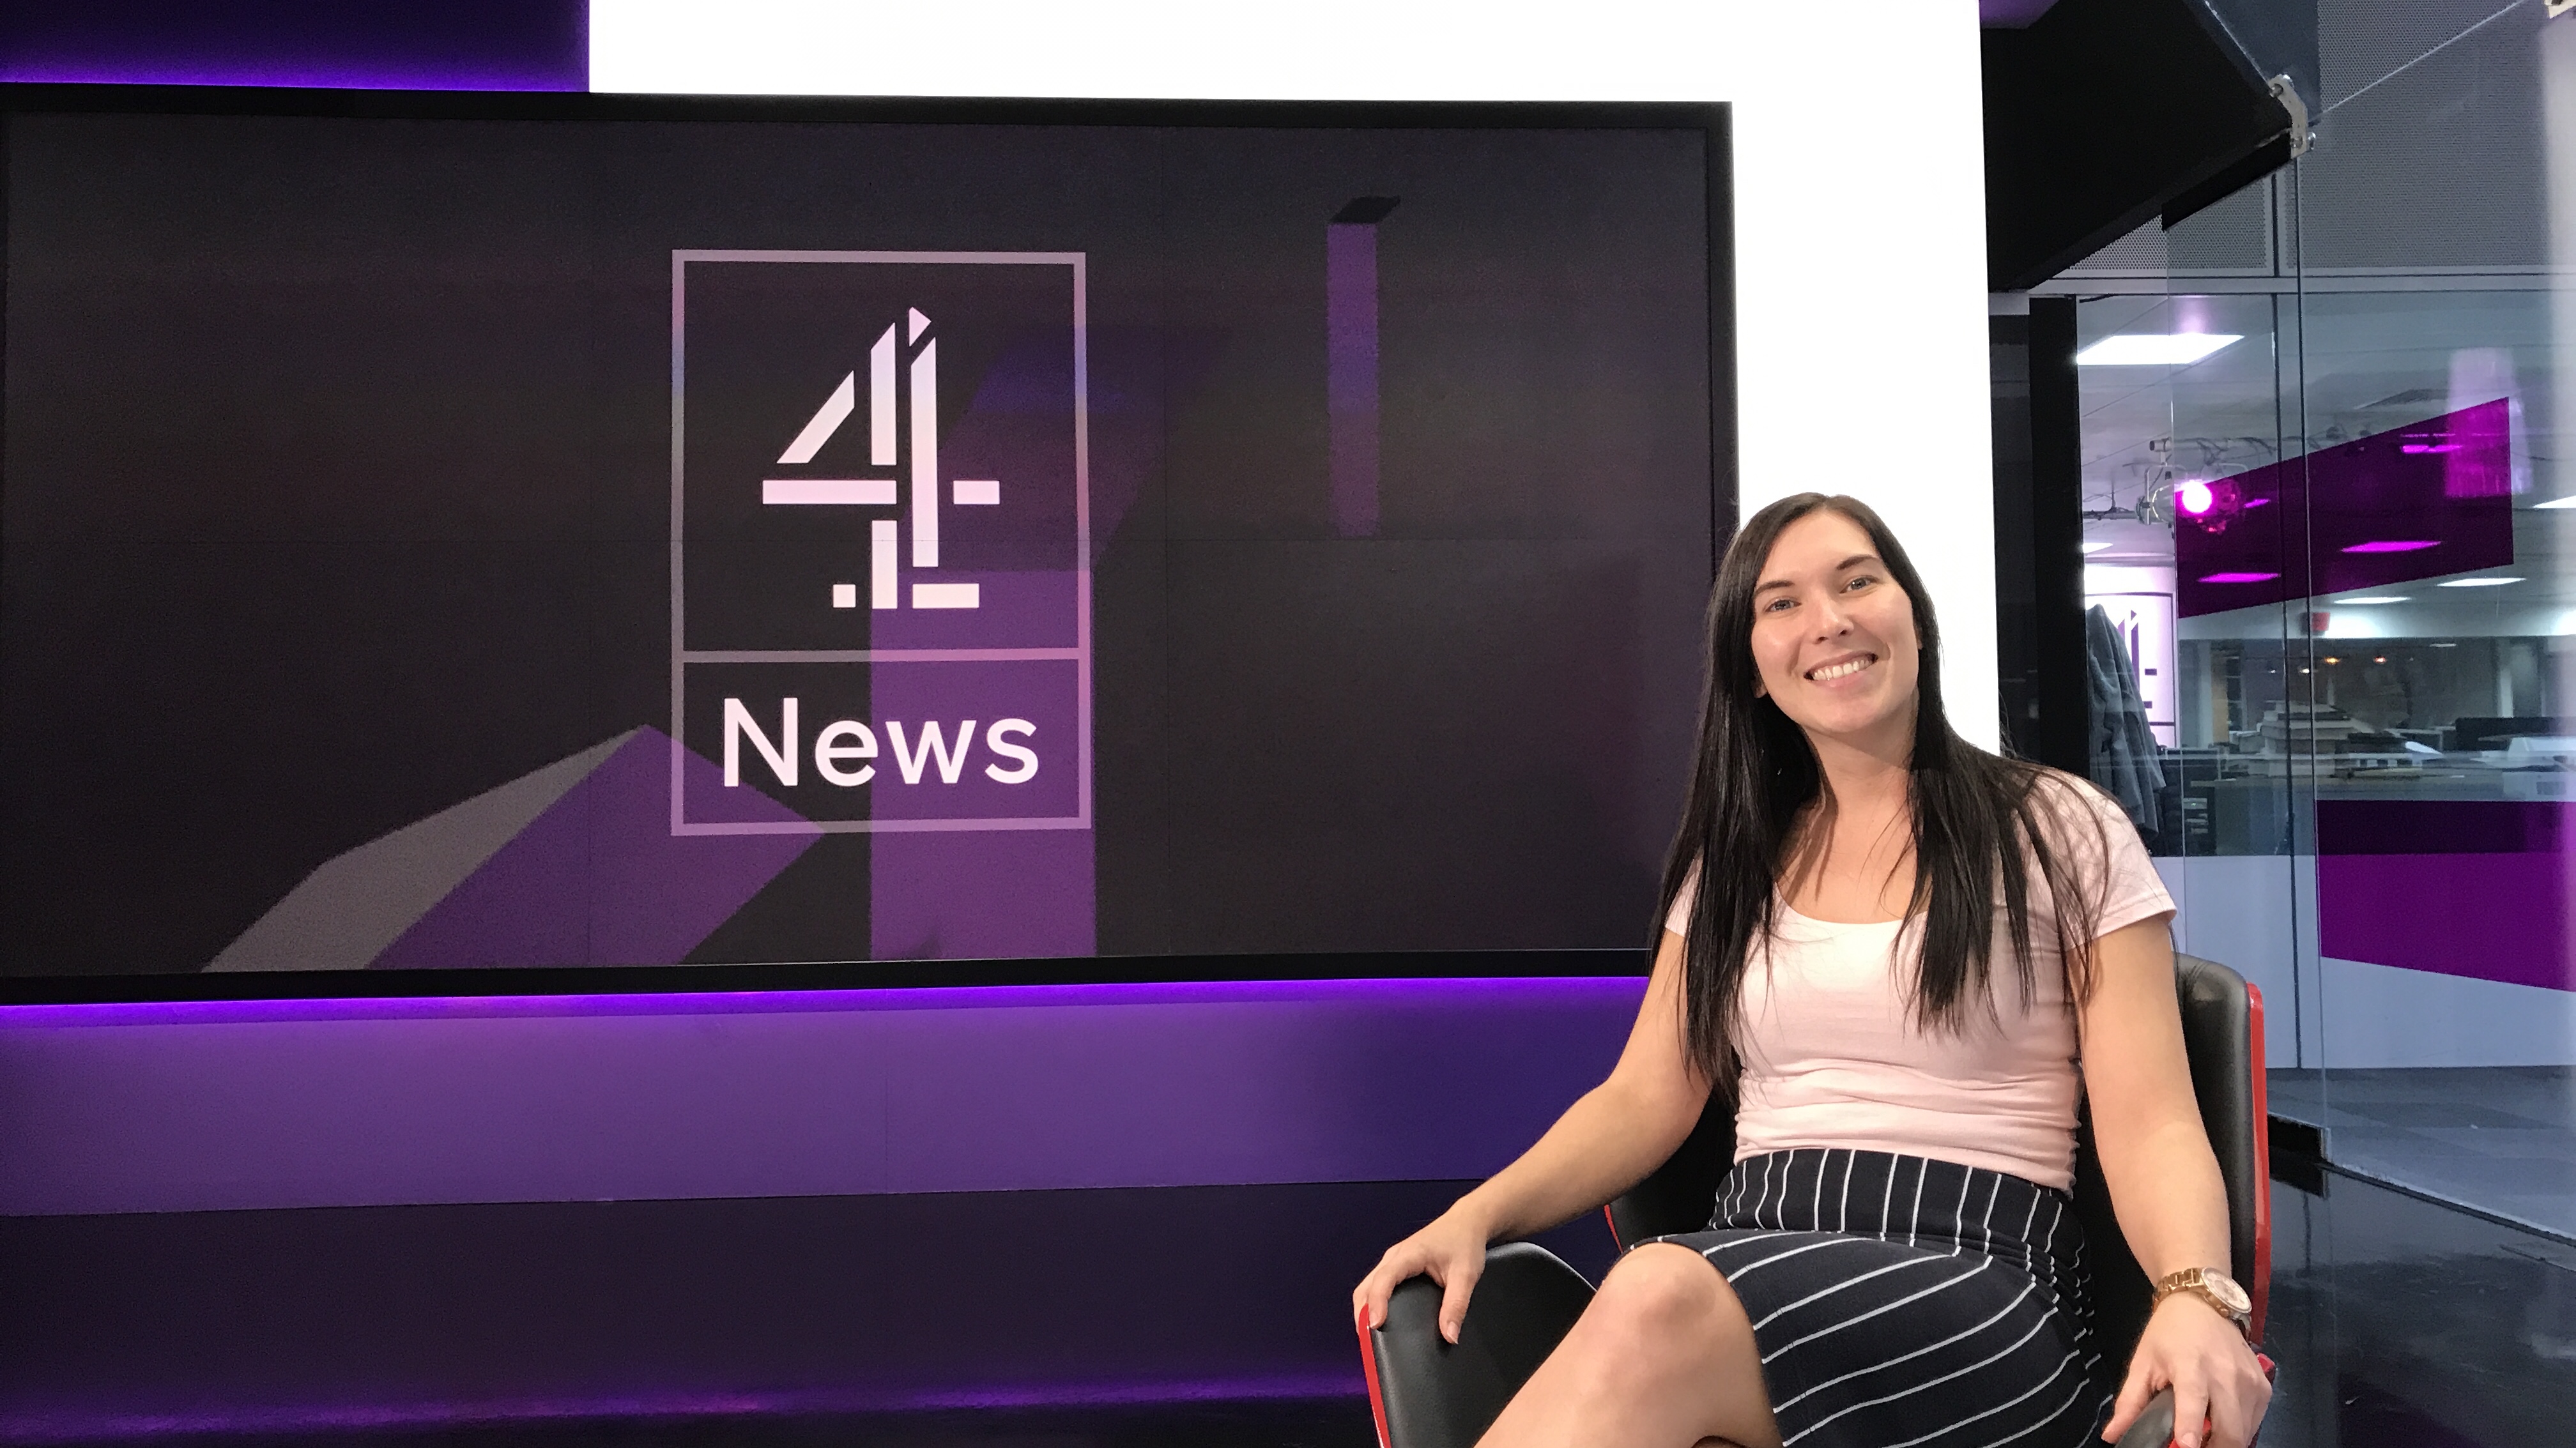
Beck Keane, Senior Research Officer attached to Channel Four News
“I was lucky enough to be based in the heart of channel 4 news- smart working fully underway, I sat with reporters (yes, that includes Jon Snow!), programme editors and web designers.
The team at Channel 4 found a lot of use in my statistical expertise. I was responsible for quality assurance of articles and pieces used for social media. I provided insight into what data would work best to display the different arguments of each of the political parties.
The team wanted to know what nationalising the rail service would really mean. I was able to use the analytical skills from ONS to determine a range of data sources available to look at rail statistics (from average prices of tickets, to how much the government contributes to the rail service) to evaluate arguments for and against the labour proposal.
I helped to share understanding of alternative ways available to compare public spending in different countries and by different parties over time, (a tricky business if you are unaware of inflation and economic climate factors).
I helped the team interpret statistics and data; understanding the nuances of ‘economically inactive’ and ‘unemployment’ – unless you work in stats, this isn’t common knowledge!
Journalists and reporters felt confident having an expert available to source credible accurate information. I helped provide the interpretation needed to make sure the public got the correct information during a time where information was vital to the wider public debate.
As an organisation, we demonstrated how useful we can actually be to some of the main users of our data. If there’s one thing news people like, it’s a good statistic.
All of us at channel 4 worked tirelessly around the clock to provide accurate information to the public, monitoring developments across social media platforms and other news providers.
Teamwork, support and flexibility were at the forefront of everyone’s work, not only across channel 4 but across the UK news network.”
Charlotte Gaughan, Methodologist attached to ITV News
“The ITN newsroom was like any other office except with more TV screens. The team I worked with were particularly concerned with how statistics could help them tell a story. Most the work I did focused on gathering data for the business and economic reporters. I did this to help ITN paint an accurate picture of a particular issue, for example debt, immigration or inflation topics.
Most journalists didn’t know where to find relevant data, and when they did, they couldn’t always find what they were looking for or know how to interpret it. Given the number of stories that are covered by the media, it’s important to find the right information. Finding the facts quickly is no mean feat.
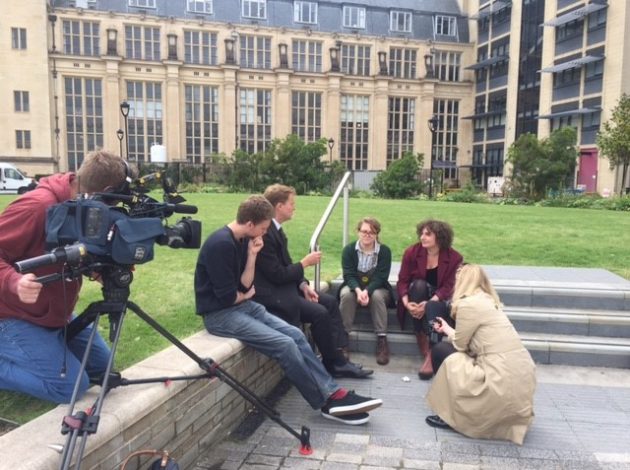
Joining the campaign trail, I went to Bristol for a day to help with a piece on debt. We interviewed a variety of people from students, estate agents to a single mother, and reported how debt and rising house prices were affecting people. This piece was aided by my statistical research.
From Bristol, we ventured to Boston to prepare a piece on immigration. We looked for people to talk on camera about their experience with migration (Boston had the highest leave vote in the UK), asked their opinions on how cutting migration could hurt local businesses. Of course, we combined the broadcast piece with relevant data.
Once again, data helped to dispel myths which had been propagated in the media.
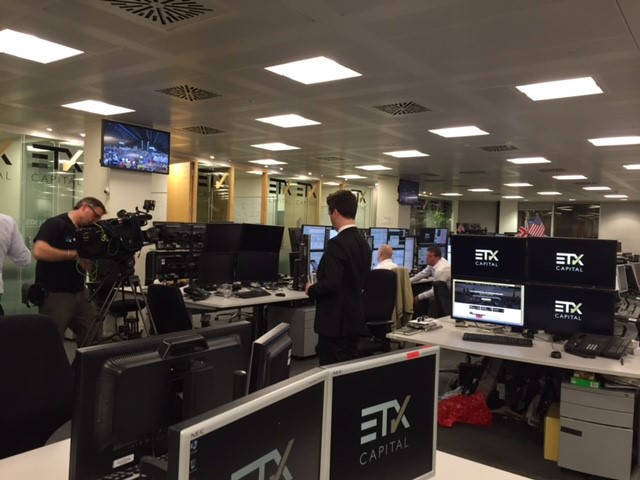
As for the election itself, there was general excitement and stress in the newsroom. Unfortunately, I spent it on a City trading floor with a camera man, watching as my purchasing power abroad fell once again.
As parliament hung in the balance, I was sent back to a trading floor, where I helped put a report together for the economics editor. With political uncertainty continuing to unfold, no one really knew what to say about the future of the economy. But that’s not unusual.”

Miles Fletcher is Head of Media and Public Relations at ONS