Why does ONS produce visual journalism?
Three years ago we unveiled Visual.ONS, a Beta website designed to experiment with new forms of digital storytelling. Darren Waters explains why ONS has embraced visual journalism, why the Visual beta is ending and what happens next.
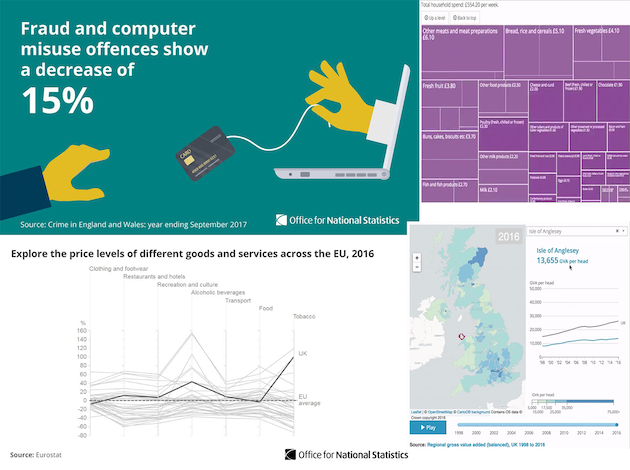
Visual.ONS has focused on producing new analysis from existing data and broadening both access to and understanding of our statistics to an audience beyond experts and specialist media.
Digital storytelling
Later this month that Beta ends, as we stop publishing on a separate site and instead integrate that analysis, that digital storytelling into the fabric of the ONS website, which then becomes the new home for such content.
But why has the ONS invested time and effort into visual journalism in recent years? What even is visual journalism?
In short, visual journalism is a relatively recent evolution of online journalism where disciplines such as data journalism, statistical analysis, design, editorial and data visualisation combine to find and tell stories from data in new accessible forms.
We believe data can be unlocked, made accessible, usable, relevant and personal through applying the approaches of digital media: Tell a story, pick out the key messages, make the complex simple, make it platform agnostic, and turn spreadsheets into stories.
Our aim has been to unlock more value from our statistics for a wide audience by thinking about how a user wants to understand, explore, learn about the topic, rather than just being the carrier of raw data.
Here are some examples of our approach:
What’s happened to international migration since the EU referendum vote? Read our simple explainer.
What about changes to the UK economy since that momentous vote? We could just tell you, but how about exploring the data yourself?
Learn more about the changing nature of the gender pay gap, explore a century of mortality data, delve into the risk of crime, find out how much your wages need to rise to match inflation and many other topics.
We embarked on this effort for a number of reasons, but primarily because the ONS has a mission to do more than just supply data.
Better Statistics, Better Decisions
The strategy which underpins the work of the ONS, Better Statistics, Better Decisions, set out our aims to:
- Make statistics more engaging, easier to understand and accessible, to find new ways to convey quality and trustworthiness to non-specialist audiences.
- Dramatically improve the communication of official statistics, ensuring that they make the right impact to serve the public good.
- Find ways for official statistics to better support democratic debate, and to provide clarity in a world of increasing information.
The ONS plays a huge role in informing policy makers and decision makes, from government to think tanks and charities. But we also have a role in informing the public and supporting democratic debate.
In the three years since Visual.ONS launched we’ve been able to reach millions of people through this editorial approach.
We’ve turned hundreds of data tables locked away in spreadsheets into products used by hundreds of thousands of people.
We believe both approaches are vital – delivering open data in forms people can use to their own ends, and creating shareable tools and content that support our aim to reach the inquiring citizen.
I’ve been asked why we don’t just let the media do this. The answer is simple – there are more stories in the data than there are journalists and publications to use that data.
We try to focus on stories and data that are underexplored, or undiscovered by media and use public data for public good.
Collaborations with the media
We’ve also started experimenting with collaborations with the media. We’ve worked with the BBC on our risk of crime calculator and an explorer of 60 years of change in the UK to mark the birthday of the Today programme. We’ve also worked closely with The Guardian on the exploration of mortality data and with Buzzfeed on gender pay.
Wherever possible we make our products and our tools embeddable for third parties to use. You may have seen our work embedded on many of your favourite news sites. After all, it’s the public’s data, your data and we want that data to be found wherever you are.
So what does the future hold?
We’ll continue to work collaboratively to produce analysis, tools, interactives, explainers, and stories for a broad audience but we’ll be publishing that content on the ONS site, rather than somewhere standalone.
We’re folding the lessons we’ve learned over the last few years into more of the work the ONS does generally – helping design better bulletins, write more relevant content, produce innovative interactives and tools.
We’re always keen to hear your feedback and understand how we can make the ONS website better, so please do contact me.
Darren Waters is Managing Editor, Publishing at ONS

Want to hear more from ONS? Sign up here for regular updates.