

There has been recent interest in seasonal patterns in the UK economy and how they are evolving. James Benford writes about the work taking place at the ONS to ensure they continue to be accurately accounted for in our key indicators, such as GDP.
Quarterly growth in GDP in 2026 Q1 is estimated to have been 0.6%. That is a relatively strong reading, though not exceptionally so. Over the last 10 years, figures have matched or exceeded that pace around 40% of the time. The rapid pace was driven predominantly by the service sector, which expanded by 0.8% reflecting broad-based growth across 11 out of 14 sub-sectors. Production expanded a little, while construction partially recovered from a poor end to last year.
At this stage, our GDP growth estimates are based solely on data covering output, predominantly from our monthly business survey. This monthly survey covers around 70,000 firms and, at this stage, already captures around 80% of the information on output that will become available to the ONS with the full passage of time, including late returns to that survey and information from VAT receipts that are processed with a lag. The monthly business survey is able to more accurately capture how the quantity of output is changing because it has a much larger sample size than monthly surveys in the private sector and requires firms to report their monthly turnover quantitatively, rather than asking more qualitative questions about changes.
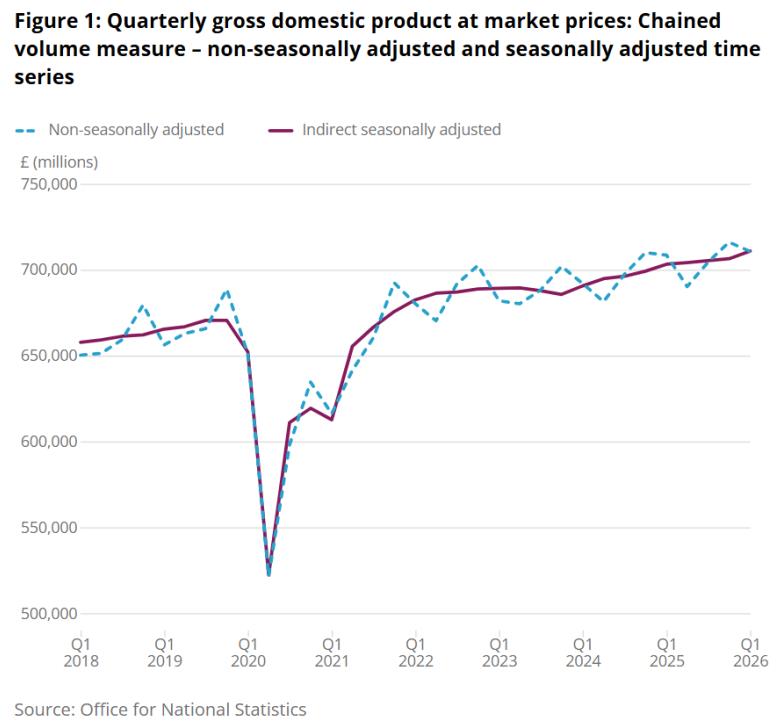
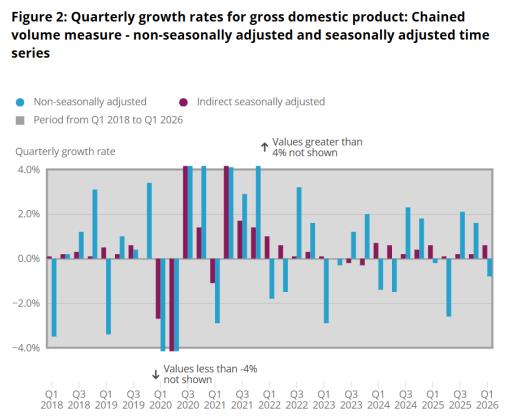
Our headline figures for GDP growth are ‘seasonally adjusted’ to strip out regular variations in the level of GDP over the course of a year. For example, there is typically a seasonal peak in activity in the final quarter of the calendar year, related in part to strong consumer spending in the run-up to Christmas. In our headline estimates, we remove these calendar-related effects so that figures provide a cleaner read on whether the latest growth rate is stronger or weaker than is usual for the time of year. Seasonally-adjusted figures for the level of GDP and GDP growth are much less volatile than the corresponding non-seasonally adjusted figures. See the charts below, which have been updated from the article earlier in the week to include today’s GDP data:


Seasonal patterns in GDP can evolve over time as the nature of the economy and the forces shaping it change. Our methods allow for seasonal factors to vary dynamically, by drawing on the most recent data to estimate what the latest seasonal pattern is. We allow for the changing structure of the economy by seasonally adjusting each of the components of GDP individually and, having done so, separately testing whether the aggregate series for GDP contains any ‘residual seasonality’. We published an article setting out the range of tests that we run on Tuesday. The methods and the tests that we use were recently reviewed by the Office for Statistics Regulation and Paul Smith, Professor of Official Statistics at the University of Southampton.
There have been large changes in seasonal patterns in UK GDP since the Covid-19 pandemic, and our estimated seasonal factors have evolved in response. The peaks in GDP in the non-seasonally-adjusted data at the end of the year are now much smaller, as are the subsequent falls at the start of the next year. In the two years prior to the pandemic, non-seasonally-adjusted GDP fell on average by 3.4% in the first quarter, but over the past two years non-seasonally-adjusted GDP has instead only slightly fallen, by 0.5%. After our seasonal adjustments, our headline estimates show GDP growth of 0.3% in the first quarter in the two years prior to the pandemic, compared to 0.6% over the most recent two years. Put differently, changes to our seasonal factors have absorbed more than 80% of the swing in non-seasonally adjusted growth.
It is inherently difficult to judge in real time how much of a variation in quarterly growth reflects a new, regular seasonal pattern, as opposed to being a more idiosyncratic variation over the course of the year. The methods that we use to seasonally adjust GDP data need a run of 3 to 5 years of data – i.e. 3 to 5 consecutive observations on growth in a given quarter – to establish what the new regular season pattern is following a change. Given seasonal patterns have been changing, we are monitoring seasonality particularly closely and have expanded the breadth of tests that we run, including by testing whether there is evidence for residual seasonality over short-run periods. In today’s release, having seen another strong out turn in the first quarter, our seasonal adjustment process has reassessed the seasonal factors for past quarters and, as a result of this and other updates, now show headline GDP growth of 0.7% in 2024 Q1 (previously estimated at 0.8%) and 0.6% in 2025 Q1 (previously estimated at 0.7%).
There are a range of factors that may be causing the pattern of activity over the course of the year to change and it is difficult to judge what the lasting regular pattern will be. In our GDP release in January this year – which covered November data – we reported that some firms had anecdotally told us that, similar to the year before, one reason why their turnover was weaker was because firms and households had been waiting for the autumn Budget before making significant financial decisions. The Bank of England described the same effect based on a much broader range of analysis in its November Monetary Policy Report . We have also reported on temporary delays to spending in the run up to budgets in previous years. A consequence of deferred spending will be stronger growth in the first quarter, as we have been seeing and are seasonally adjusting for. It is, however, inherently difficult to judge how much of this is part of a new regular pattern, that might be established with the move to a single fiscal event, and how much it reflects temporary changes relating to a period of adjustment following Covid-19. Last year’s Q1 may have seen some activity brought forward ahead of the introduction of US tariffs and changes to Stamp Duty.
An alternative measure of growth, which will be more robust to changing patterns of activity between quarters, is to take a simple average of GDP growth across the last two-quarters. Across 2025 Q4 and 2026 Q1, GDP growth has been 0.4%, which is broadly in line with its historic average.
We also published in our monthly GDP release today a review of the partial data we have on spending on April which, on balance, point to some weakening going into the second quarter. Indicators of consumer demand suggested some easing during the month. That is consistent with anecdotal evidence from firms that reported to us a weakening in some areas of consumer spending in March, following the conflict in Iran, that was at least in part offset by stronger spending in other areas due to stockpiling in anticipation of higher prices. Initial results from our Business Insights and Conditions Survey show that over a quarter (27%) of trading businesses reported that their turnover had decreased in April 2026 when compared with the previous month, up 4 percentage points from March 2026.
The ONS will keep estimates of seasonality under close review as more information becomes available and will continue to engage closely with users on the topic. We have benefited greatly in recent months from a review by the Office for Statistics Regulation (OSR) and with conversations with users such as the Bank of England on their own analysis of our data, who also fed into the OSR review. We have this week responded to recommendations from the OSR review by publishing a methods article on our approach to seasonal adjustment and publishing estimates of non-seasonally adjusted GDP at the component level.
Statistics work best when there is strong collaboration between producers of statistics and users. We always welcome feedback and suggestions for how we could improve what we are doing. Should you have feedback please contact me at james.benford@ons.gov.uk.


James Benford is Director-General for Surveys and Economic and Social Statistics at the Office for National Statistics.