

Exports of services have for many decades made a large and positive contribution to the UK’s international trade balance. But unlike goods, which are relatively easy to count and value, the intangibility of services means their measurement has been less detailed. Now, thanks to a big expansion in our statistical coverage, ONS is shedding unprecedented new light on the subject. Katie O’Farrell explains how…
When we started to review UK trade in Services in 2016 our offerings were relatively limited. We could provide a breakdown of trade in services – data on financial services, or data on transport services, for example – but only at a whole world level. Alternatively, we could provide estimates of total trade in services with individual countries, but not broken down by service type.
So we couldn’t value our financial services trade with the US, or travel with France or transport with Japan. At a time when the spotlight is falling on the UK’s international trading relationships this had to change fast.
To put matters right we focused first on improving the existing data and systems supporting the production of services data. We expanded the International Trade in Services (ITIS) survey, optimising the quarterly sample for both improved industry and geographic coverage.
Alongside this we re-built the services data production system, streamlining it to allow for better data interrogation and enhanced quality assurance. These two crucial steps allowed us to produce our first new data in October 2018, which were experimental, quarterly estimates of detailed trade in services breakdown across a wide country set. You can find the most recent release here.
This new publication was the stepping stone for further innovations. Users of trade statistics had long been asking us provide data not just on the service that was traded, but the industry that that trade was associated with.
Using the new ONS ‘strategic data platform’, we were able to link the improved ITIS microdata with business register information, alongside other ONS sources, to produce experimental trade in services by industry in May 2019.
These new releases mean the contribution of different industry sectors to the UK services economy, and services trade by industry with bilateral partners, can now be estimated, which is a significant step forward. As this dataset is quite complex, we also built an interactive map for users to more easily find the data they were looking for.
We have also updated the methods for producing sub-national GB services exports, which is a result of developing these estimates of different industry sectors. By collaborating across teams, these data add an even richer picture to trade in services, allowing users to see the value of services exported by industries at a really detailed level across the country. The new data has been released this week.

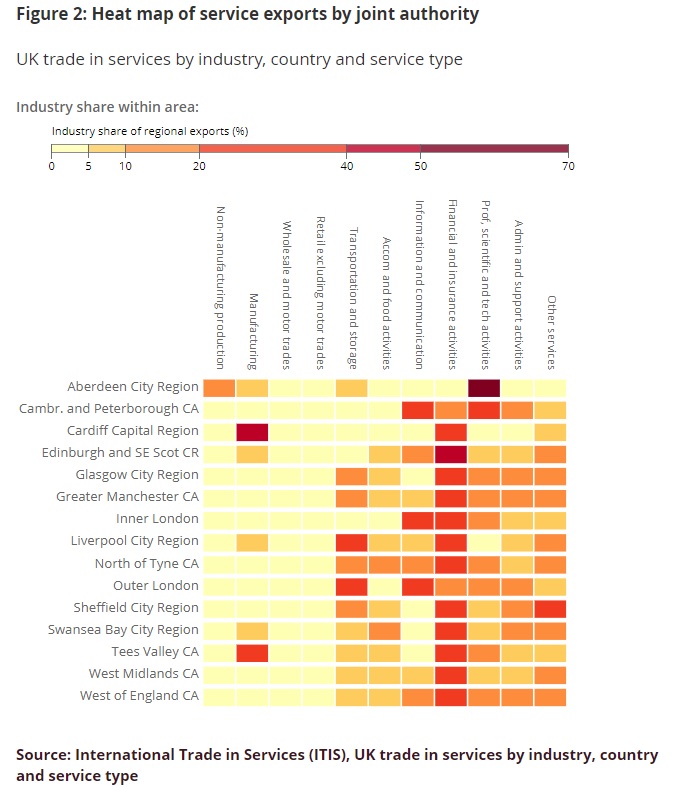
An interactive heat map of service exports by joint authority has been published alongside the recent International exports of services from subnational areas of the UK in 2017 statistical bulletin
As well as needing to know the value of trade in services the UK conducts with other countries, users also want to know how that trade is conducted. Known as modes of supply, this approach splits services data by whether the service was supplied remotely with no movement of people (for example, via email), where the person receiving the service travelled to the other country (for example, tourism), or whether a supplier travelled to the customers country to provide the services. After a long period of survey development, working closely with businesses to be sure they could provide the type of data we needed, we released new data on modes of supply in July 2019. This was a challenging but hugely important piece of work; very few countries have attempted to measure services by modes of supply and in the case of those who have, the measures are based on assumptions rather than the more precise methodology developed by our teams.
While our work to overhaul our trade in services is far from complete, our new statistics are giving businesses and policy makers vital information that they need to take key decisions. Taken with other work we have been undertaking to revamp our trade in goods statistics, we were now producing 100 times more trade data series than we did four years ago, which is a significant improvement.


Katie O’ Farrell, UK Trade Product Manager at the ONS