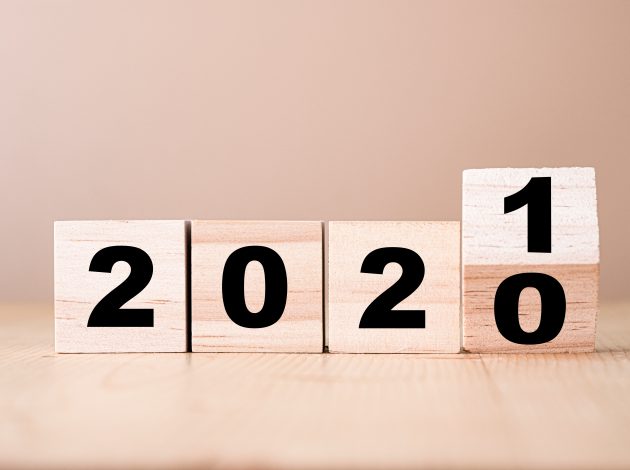
Understanding excess deaths during a pandemic
To give meaningful comparisons of mortality over time, the Office for National Statistics uses a five-year average. This is designed to show us the expected number of deaths for a given year. However, the pandemic has had a big impact on this average and of what a ‘normal’ year looks like. Sarah Caul explains why, for 2022, the year 2020 will not be included as part of our five-year average.
Analysis of all-cause mortality allows us to examine the impact of the pandemic – not only from deaths due to COVID-19 but also excess deaths that have occurred as a result.
For excess deaths, we compare numbers and rates to a five-year average; this ensures that we are comparing like for like in terms of life expectancy, advances in healthcare, population size and age structure. Averaging over five years removes the fluctuations seen year-on-year. Usually we use the most recent five years, for example we compared deaths in 2020 with the five-year average for 2015 to 2019.
When looking at deaths in 2021 we used the five-year average for 2015 to 2019 again (rather than 2016 to 2020) because of the impact of the coronavirus (COVID-19) pandemic on deaths registered in 2020. The average for 2015 to 2019 provides a comparison with the number of deaths expected in a normal (non-pandemic) year; an average of 2016 to 2020 would not have been helpful as a comparison.
What are we doing for 2022?
We discussed at length how to move forward with the five-year average with colleagues across government including the devolved administrations. The years 2015 to 2019 are still the most recent years which were not impacted by COVID-19, however the further we move away from 2015 the less helpful this measure becomes due to the changing structure of the population.
Including 2020 in the five-year average would greatly increase the number of deaths we would class as ‘expected’ each week, because of the peaks of the pandemic, and therefore decrease the number of ‘excess’ deaths counted.
The decision was made to move to an average of the following five years: 2016, 2017, 2018, 2019 and 2021. This moves our five-year average along by a year but does not include the exceptionally high number of deaths seen in 2020. It allows deaths in 2022 to be compared with a five-year average that is as up-to-date as possible while still being close to representing a ‘normal’ year. This methodological change will be reflected in the “measuring the data” section from Week 1 2022 of the weekly deaths bulletin.
Although 2021 was still impacted by the pandemic, this wasn’t to the same extent as 2020. Comparing the average of 2015 to 2019 and 2016 to 2019 and 2021 we see that 37 weeks do show a higher five-year average and 15 show a lower five-year average. On average, the number of deaths in the five-year average has increased by 213 deaths (a 2% increase).
What other options did we consider for 2022?
Before deciding on this method, we considered other possible combinations of years, or developing a more complicated formula to overcome the distorting effect of 2020 deaths. None of the other options was preferable and we thought a simpler, easier to understand method would be best.
We considered removing deaths involving COVID-19 from 2020 and 2021 and then calculating a five-year average, but that would have underestimated the number of deaths in both years and thereby artificially increased the ‘excess’ seen in 2022.
Removing the deaths involving COVID-19 would not be a reasonable approach because many of those individuals would have died in the same year even if the pandemic had not happened – but we cannot know how many. Others would have died in the following year or might still be alive. The statistical modelling needed to estimate the ‘right’ number of deaths had COVID-19 not happened is complicated and would not be easy to apply reliably or explain to readers.
The five-year average is important to show the number of excess deaths in a given year, however it is only one of the measures used by ONS. We also look across individual years as part of our monthly mortality analysis release where we are able to use age-standardised mortality rates which take into account the age and structure of the population.
For users who wish to continue using the 2015 to 2019 five-year average or for those who wish to use a different average, for example 2017 to 2021, the information needed for this is published in previous years’ deaths registered in England and Wales weekly releases.

Sarah Caul MBE, Head of Mortality Analysis at ONS