Supermarket Sweep: Measuring inflation with billion of bleeps
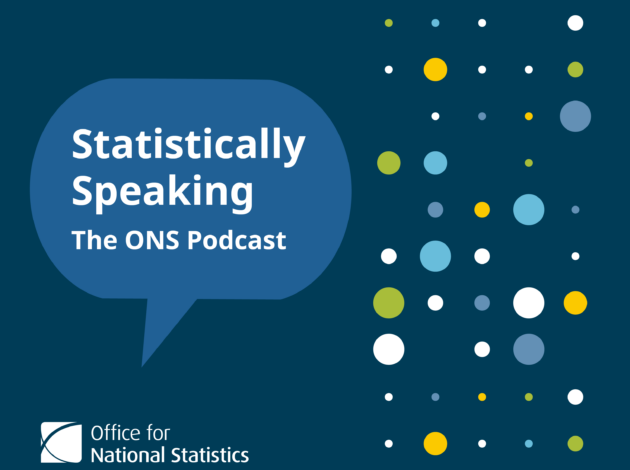
Supermarket Sweep: Measuring inflation with billion of bleeps
The latest episode of the Statistically Speaking podcast reveals how the ONS is now measuring UK consumer price inflation with data gathered from supermarket checkouts. Our guests explain why it’s a step change in the production of this vital economic indicator that broadens our understanding of the real cost of the living.