Understanding ONS statistics on patient deaths.

Jamie Jenkins looks at the ONS data behind news stories on deaths from starvation and thirst.
“You may have seen dramatic headlines in in the last few days suggesting that large numbers of patients in hospitals and care homes are dying from malnutrition or dehydration. But do these headlines give an accurate picture of the data?
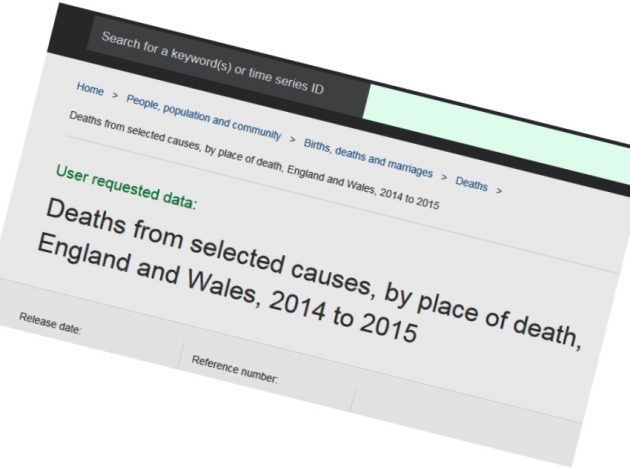
Well, following a request for additional data beyond the regular annual deaths figures, we published two tables. The first shows the number of deaths where a certain condition is the ‘underlying cause’ of death, or what most of us would understand as the main reason that person died.
What this shows is that in 2015 there were 47 deaths in hospitals and care homes where dehydration was the underlying cause of that death and a further 66 where malnutrition was the underlying cause.
But we also published a second table which looks at the number of times dehydration or malnutrition are mentioned on the death certificate as being a factor in the death but were not were not the underlying cause of the death. For example someone may have died of stomach cancer which may have caused difficulties in the consumption of food and/or water. The underlying cause may then be recorded as stomach cancer but with a mention of dehydration and/or malnutrition as contributing to the death.
There were 505 deaths where dehydration was a contributory factor and a further 351 here malnutrition was mentioned. It is these figures that were frequently highlighted in the media, rather than those on underlying cause.
But it is also important to remember that some individuals will have suffered from more than one condition, so they will be included in the table more than once. This is why you should not add together the numbers in Table 2 to find the total number of deaths, because this would double-count people. This is because Table 2 is based on deaths where these causes were mentioned anywhere on the death certificate, either as the underlying cause or as a contributory factor.
It all sounds complex doesn’t it? ONS gets hundreds of such requests every year so it’s not uncommon for figures not published in the original release to be published at a later date and
we try as much as possible to explain what the data can be used for. In this example we have several other tabs with important information to interpret the data and so I would encourage anyone using the data to read this or speak with one of our team of experts.”
You can get in touch direct with the team at mortality@ons.gov.uk

Jamie Jenkins is Head of Health Statistics at ONS Follow him on Twitter