Using Flow of Funds to measure the effects of Quantitative Easing
Many of us have heard of “Quantitative Easing”. Some even claim to know how it works. Summarising an article published in the ONS Economic Review, Rikesh Patel explains the purpose of this important intervention by the Bank of England and how experimental flow of funds statistics can help us assess its effects.
What exactly is Quantitative Easing? Put simply it is the Bank of England directly injecting newly created money into the economy in order to encourage consumers and businesses to spend more.
In March 2009, the Bank of England was concerned that it was not able to cut interest rates further to stimulate the economy in the wake of the 2007-2008 financial crisis and that inflation might drop below its target. Worse still, there were concerns that inflation might turn negative.
The idea behind QE was that the Bank of England first creates new electronic money to purchase UK government bonds from private sector financial firms, such as insurance companies and pension funds. The plan was that these firms would then use this new cash to support the rest the economy – for example through investing in the economy by buying corporate bonds, or making more loans to businesses and households so that the money flowed around the economy. This boost in economic activity would then, hopefully, push up inflation back to the 2 per cent inflation target.
Research indeed finds the holdings of corporate bonds of insurance companies and pension funds had increased as a result of QE. However, we need to find out to whom these have gone. For example, did the new investments go to local companies or foreign firms? Were there sectors that benefited more than others? What about the impact on small and large corporations? Clearly, depending on the answers the implications of QE on the economy could be very different.
What are the Flow of Funds statistics?
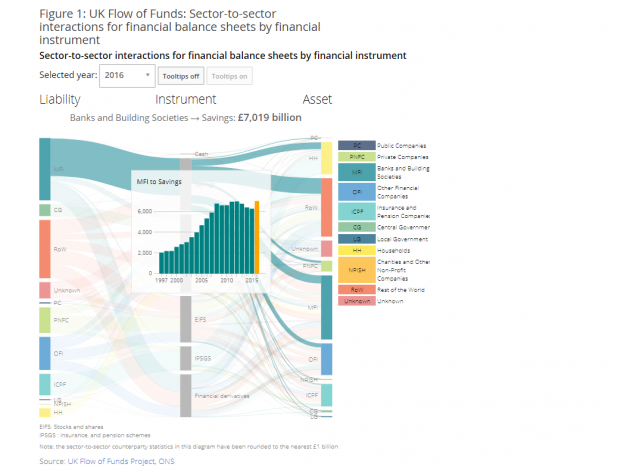
The ONS has set up an ambitious initiative in partnership with the Bank of England to enhance the coverage and quality of Flow of Funds statistics in the UK. The centrepiece of this initiative is to develop statistics that will improve the picture of how money moves in, out and around the UK economy and where risk is building up. These Flow of Funds statistics can help us understand how QE operates.
What could FoF statistics tell us about QE?
Let us use a picture to summarise how the QE cash (red arrows) gets spent in the economy:
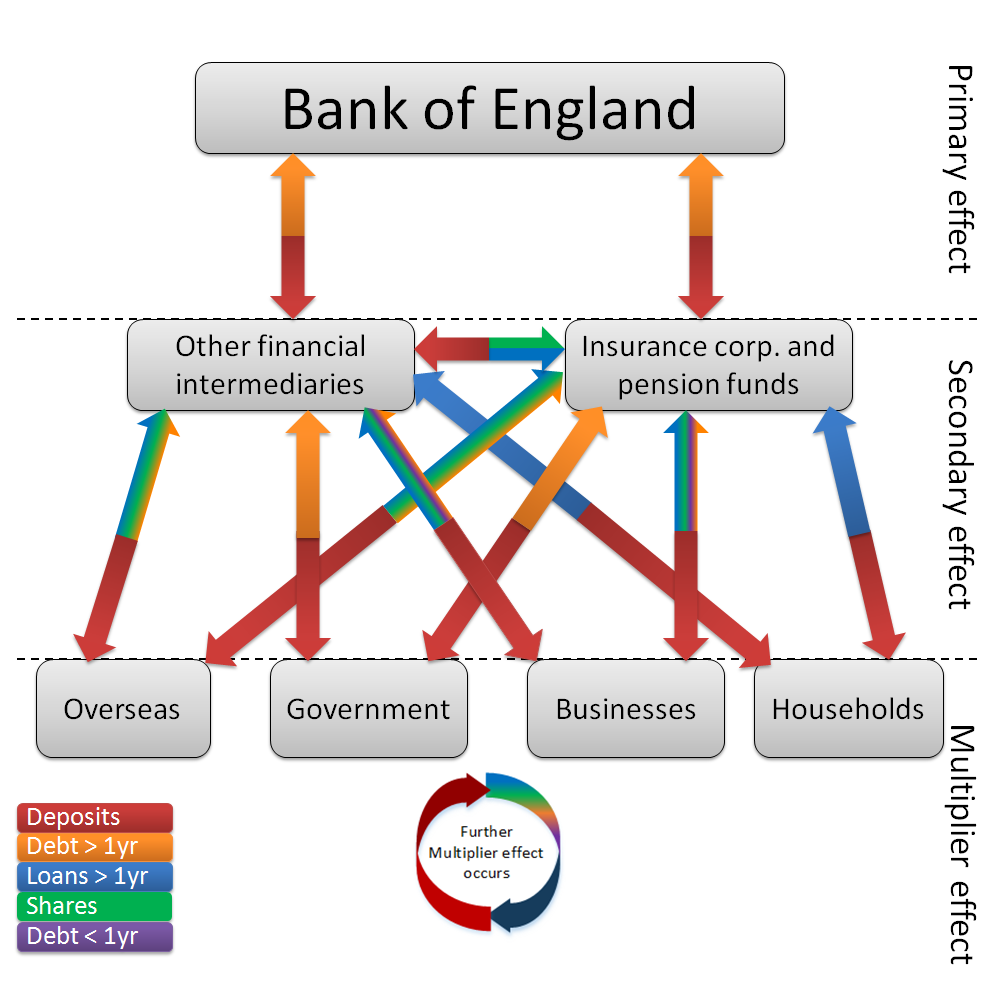
There are a lot that can happen to that money, depending on the decisions of the financial firms that first receive it. For example, they may decide to lend it to businesses and households, or they can invest in shares, or they may even invest overseas. Once the cash changes hands, further investing and spending decisions will be made and the money will move round the economy.
It can get complicated quickly and become impossible to disentangle within the standard data. But the good news is the FoF statistics can capture the entire picture and track all these transactions. This opens up the possibility of answering questions that could not be answered before, like “did the money get to your pocket?”, and if not, “where was it stuck?”
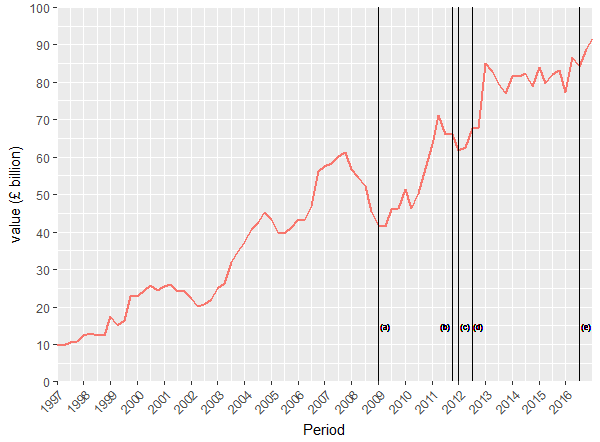
For instance, let’s look at how the insurance companies and pension funds may have invested the QE money. The FoF statistics show that their lending to businesses increased after most rounds of QE, which should be good news to the economy.
What does the future hold for flow of funds?
The experimental FoF statistics will be further improved over the next few years. We will increase the detail of the breakdowns of financial instruments and counterparty sectors; coverage of the economy will be more complete and we will incorporate more data sources. Throughout the development we will be publishing progress updates and analyses on interesting topics that helps highlights how these statistics can be used. Stay tuned. There is much more to follow.
Rikesh Patel is an Assistant Economist for the ONS