Early warning signs: How faster data will help policy makers take better decisions

The arrival of new faster economic indicators from the ONS gives policy makers early warning of changes in the UK economy. Louisa Nolan explains how these experimental data are compiled and how they should be interpreted.
The new indicators use innovative data sources developed in the ONS Data Science Campus. Together they provide a new view of the UK’s economic activity up to a month sooner than was previously possible.
For the first releases we’re using the latest VAT returns for more than a quarter of a million businesses provided by HMRC. We will also draw on road traffic sensor data for England from Highways England. Ship tracking data from automated identification systems (AIS) for UK waters will be added in the coming months.
What the new data can tell us
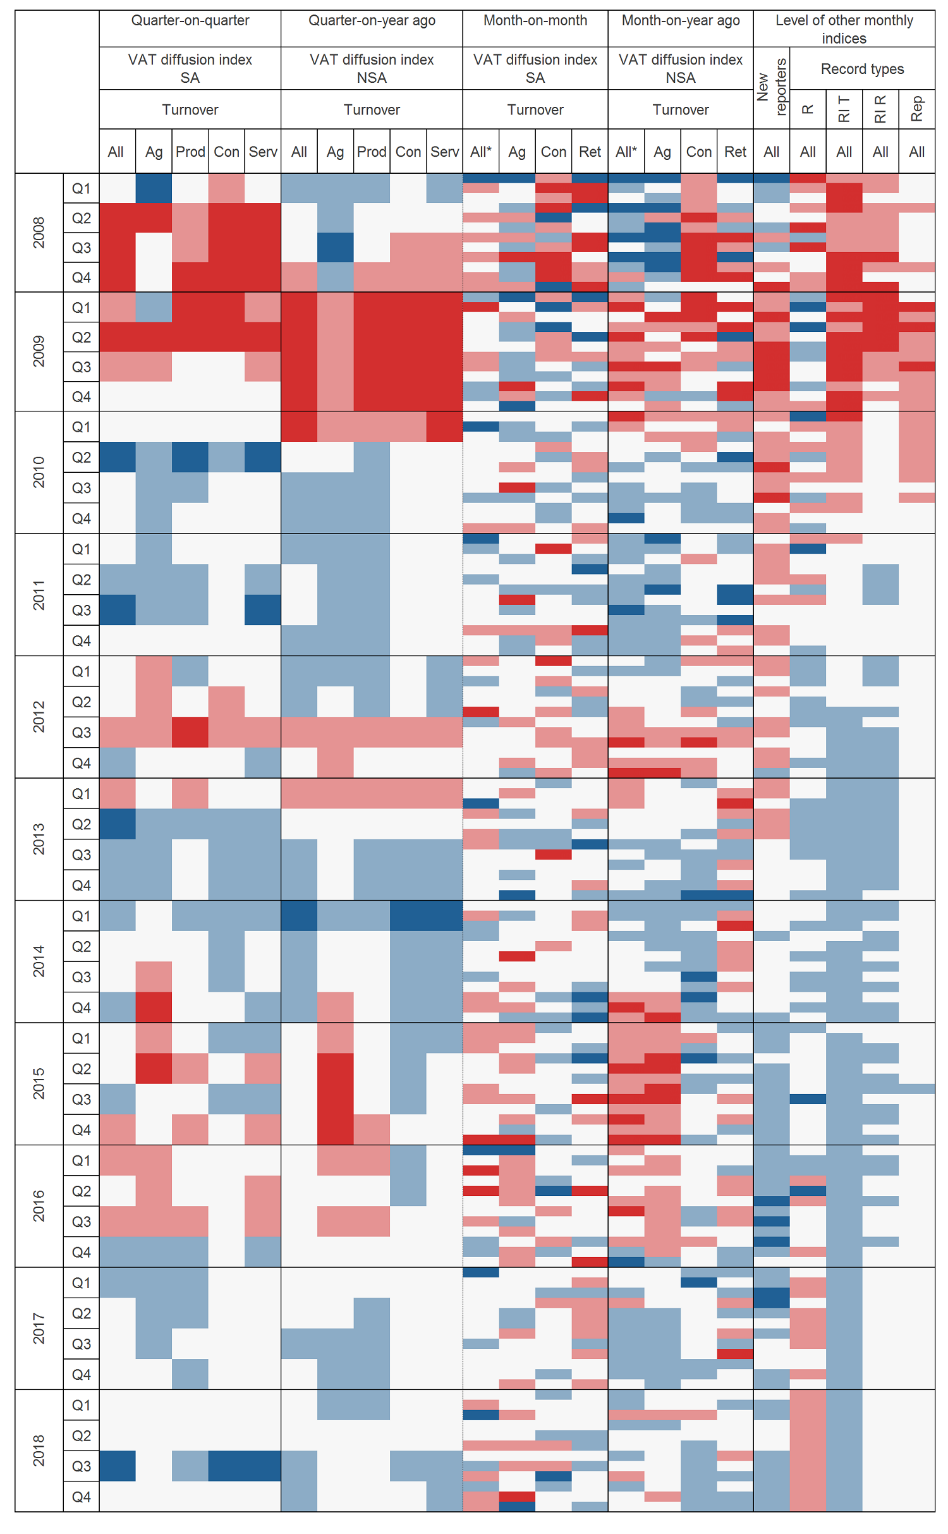
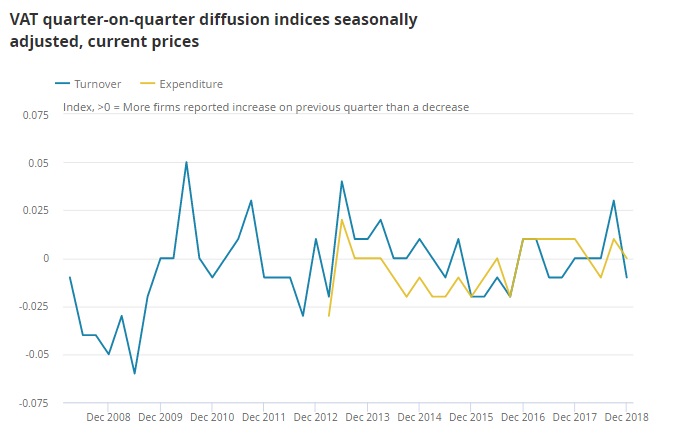
A range of indicators have been constructed from the VAT returns, including a ‘diffusion index’ for each month based on whether more companies sending in returns are seeing growth in their turnover or not.
As well as publishing the underlying data, for headline indicators we will also give an indication of whether its current level suggests activity is above or below its average rate. This will be presented as a heatmap, to give an overview across the indicators. Our first publication on Monday will provide information on changes in turnover and expenditure up to the end of March 2019.
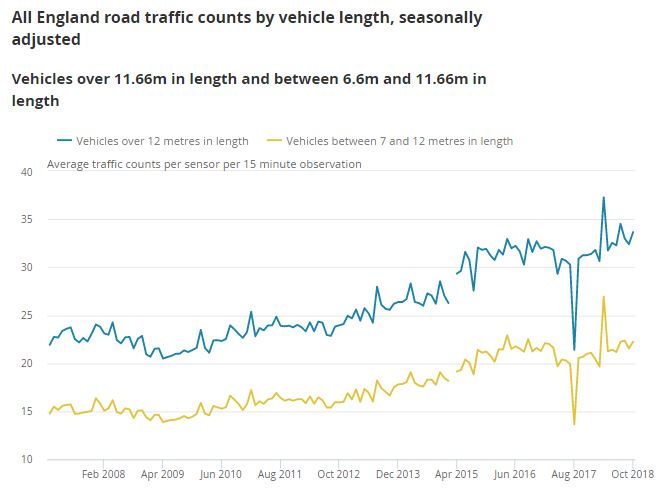
Meanwhile, the road traffic indicators will show whether during a period the level of road traffic is growing or not. In Monday’s publication we will provide data on roads up to February.
What it can’t tell us
While this new suite of indicators will hopefully give policymakers early warning of changes in the economy it’s important not to conflate them with our regular official estimates of GDP and trade. Those provide much more detailed numerical insights into how some economic activities have changed over a given period.
Nevertheless, we trust these new products will be a useful addition to the array of data policy makers can draw on to make key decisions.
While the launch is an important milestone, this is only the beginning of our journey in developing these new indicators. We will continue to refine them over the coming months to ensure they can give as much useful information as the availability of data allows.

Dr Louisa Nolan is lead data scientist at the ONS Data Science Campus.