
Managing the trade-off between timeliness and accuracy in producing our best estimates of GDP

GDP revisions are often reported, but how much do users understand why revisions are a necessary part of the evolution of the GDP dataset? Andrew Walton and Sumit Dey-Chowdhury explain the compilation process, recent GDP revisions performance, the different reasons for revisions and how the ONS is making improvements to the measurement of GDP.
Compiling GDP is a complicated task – not only for the UK, but for all National Statistics Institutions across the world. In the UK, the value of the economy in 2025 is estimated to be £3.0 trillion; this estimate is compiled from over 349 data sources in the annual production round with a time series which goes back to 1948. In the UK, we produce a first estimate of quarterly Gross Domestic Product (GDP) 6 weeks after that quarter ends, alongside our more timely monthly GDP estimates around 40 days after the month ends.
One feature that is not always fully appreciated is that our first estimates are only the start of a data production cycle that takes three years to complete as more data become available and we refine our estimates. For example, we will have some rapid survey information that feeds into these early estimates, such as the Monthly Business Survey which goes to over 34,000 businesses. These enable us to produce an estimate of movements in GDP within only 6 weeks of the end of a period. Over the weeks and months that follow, we get more complete survey information from households and businesses, while we also get some early insights from administrative information, such as VAT. These early estimates become supplemented and/or replaced by fuller data sources to complete the picture around 3 years after the period being measured. This includes a full reconciliation of GDP as we complete this data production cycle, including by a detailed 112-industry and a 112-product breakdown which provides a richer understanding of supply and demand in the economy.
Managing the trade-off between timeliness and accuracy leads to an inevitable feature of revisions. It is better to have an early estimate of GDP that might be prone to subsequent revision, than to have no estimate at all.
Revisions reflect estimates improving over time as more information and better methods become available and are a natural evolution of the statistical process. Open communications are integral in explaining revisions, including how these change over time. We are committed to being completely transparent about our revisions, including in our communications and make a wide range of outputs available to allow users to monitor our revisions performance over time.
We publish real-time estimates of GDP, which enables users of our data to track the revision performance over time. For instance, there is a mean revision of 0.1pp to the first estimate of quarterly GDP growth over the last 60 years. In our latest GDP revisions article we confirmed that there has been no evidence of a first estimate being statistically significant different from zero in the period since 2000 – that means there is no tendency for the first estimate to be consistently revised up or down in the period since 2000.
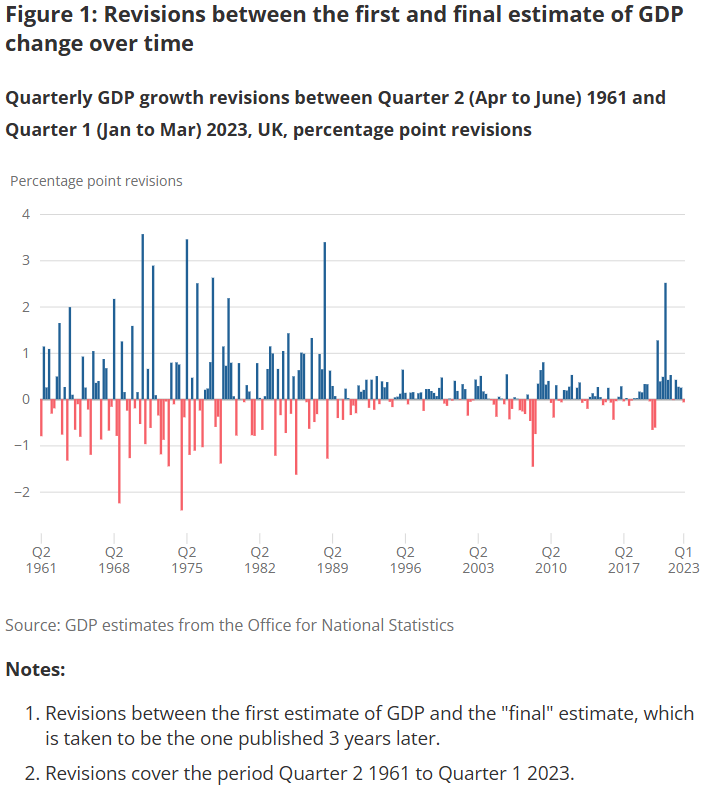 View the data used to create this chart.
The average pattern of revisions over a long period does not describe how the profile of revisions has evolved over time. As we set out in our latest GDP revisions article, our revisions performance has, in general, tended to improve through time, with the periods since the early 1990s showing much smaller mean absolute revisions at both 3 months after the initial estimate and the ‘final’ estimate that is published 3 years later, with the exception of the coronavirus (COVID-19) pandemic period of 2020. Until the early 1990s the average estimate of the three approaches to measuring GDP (income, expenditure and production) was the basis of the headline estimate. In 1992 we moved to reconciling the three independent estimates and estimates of current price GDP were balanced for the first time in the Supply and Use Tables framework.
It is difficult to extrapolate from past revisions performance to how data will be revised in the future. The nature of our first estimates of GDP growth has changed over time and will continue to do so as we further improve our methods and data sources. Estimates can also be more, or less, susceptible to revisions dependent on the state of the economy.
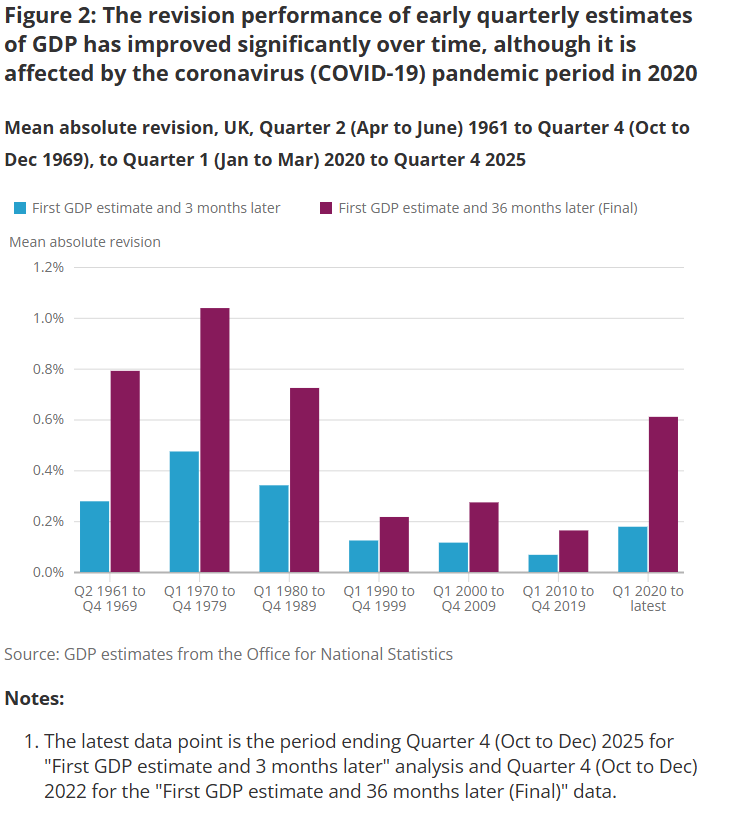 View the data used to create this chart.
In the more recent past, revisions were larger during the global financial crisis and the Covid-19 pandemic and the subsequent recoveries. Outside of recessions and recoveries, since 2000 average revisions have been close to zero (+0.04pp) and the average absolute size of revisions have been 0.2pp. However, during the last two recessions and recoveries, both the average and absolute size of revisions has been around 2 and half times larger. This in part reflects the significant additional uncertainties around economic measurement that come at a time when the economy is changing rapidly following a large shock. When we make our early estimates, we have to make assumptions, and these are tested during periods of rapid change. But we do look back at the drivers of our revisions and seek to learn from them and improve our measurement system.
| Full time period | Recessions and recovery | All other time periods | |
| Average growth | 0.4% | 0.1% | 0.5% |
| Mean revision between first and final estimate | 0.1% | 0.2% | 0.0% |
| Mean absolute revision between first and final estimate | 0.3% | 0.5% | 0.2% |
Source: GDP estimates from the Office for National Statistics
Notes:
1. Full time period relates to Quarter 1 2000 to Quarter 4 2025
2. Recessions and recoveries defined as period from first fall in GDP to the point when it recovered beyond the previous peak Quarter 2 (Apr to June) 2008 to Quarter 3 (Jul to Sep) 2013 and Quarter 1 2020 to Q3 2021.
3. On this definition average growth is positive given the final quarter goes beyond the previous peak.
4. Final estimates are at three years after the first estimate, and include data upto Quarter 4 2022
Our early estimates of GDP assume that the movements in firms’ turnover or gross output are a reasonable proxy for movements in their gross value added (gross output less intermediate consumption) and so GDP. We need to make this assumption in our estimates because we do not get data on intermediate consumption until we collect the annual business surveys, which comes later in our production cycle. The post-Covid recovery period was challenging, as energy and broader input prices were rising rapidly and firms economised on their intermediate inputs. However, we were only able to assess our assumptions on intermediate consumption use when we processed our annual business surveys and, as a consequence, revised up GDP growth in 2022 due to weaker growth in intermediate inputs with the Blue Book in 2023.
We are currently looking at how we might better capture movements in these intermediate inputs in our earlier estimates of GDP to give a better approximation of GDP. We are investigating the use of Value Added Tax (VAT) purchases data, linked to our Quarterly Acquisitions and Disposals of Capital Assets survey (to remove capital purchases which do not count towards intermediate consumption), to provide estimates of intermediate consumption within three months of the quarter ending. This will enable us to make adjustments to the intermediate consumption ratios nearly two years quicker in times of shocks in the economy.
Another type of revision that can take place is when we bring in methodological improvements to how we measure GDP. Reasons for changing our methods can vary. Often, we will be implementing the latest international best practice. On other occasions we may have identified a discrepancy between different data sources that we then seek to resolve. One recent example, that we implemented in last year’s Blue Book, was an improvement in how we record Research & Development in the UK economy, where we recognised that our surveys were out of line with tax records and were not adequately capturing how much firms were spending on R&D investment. Bringing the two into line increased the level of GDP, as we captured economic activity that we previously did not.
Another example is how we look at the value of data in the economy, which is fundamental to many business models. Many businesses now make investments in collecting and curation some form of data, but this has not yet been recorded as part of GDP within the international frameworks. As part of new updates to the international manuals, we, along with other countries, will be recording data as an asset as part of UK GDP in the coming years. This will naturally lead to revisions to the size of the UK economy.
These examples illustrate that economic measurement does not stand still. We need to reflect and update to capture a dynamic and modern economy.
Each year we take through improvements and updates into the National Accounts to ensure we provide the best possible estimates. To help users understand these changes we provide additional material in advance including 3 detailed methodological articles which were published in June on the Annual Survey of Goods and Services (ASGS), improvements to the local government measure of intermediate consumption, and improvements to private actual and imputed rentals in household expenditure. Additional articles will be published on 20 August providing likely impacts which will then be incorporated into our estimates of UK GDP at the end of September.
In this year’s annual update, we are fully integrating a significantly new data source which will improve our measurement of the service sector, where we will use data from the Annual Survey of Goods and Services (ASGS).
The method for implementing this improvement was agreed at the Advisory Panel on National Accounts in their 3 March meeting.
As with UK Manufacturer’s Sales by Product Survey (PRODCOM) in the manufacturing sector, the ASGS data will now be used to allocate industry level output derived from the Annual Business Survey (ABS) to individual products. This represents an important quality improvement, fully replacing historical product patterns derived from our previous Services Turnover Survey. The 2026 data release will include the full range of the ASGS data, following a substantial and detailed quality assurance process.
Full details of the impact of this, and all the other methodological improvements and data revisions, will be provided in 2 articles which will be published on 20 August 2026.
In conclusion, revisions are a regular feature of the compilation process of measuring something so complex as the UK economy, where we seek to balance demands for both timeliness and accuracy. We are committed both to transparency over revisions and the drivers of these revisions and to learning from them to improve how we produce early estimates of GDP. Revisions can also reflect methodological improvements in which we look to improve how we measure the economy today, which will always evolve over time. We have shown the limitations of extrapolating past GDP revisions performance to inform how revisions might evolve in the future.
We work hard to communicate the nature of upcoming revisions and explain the changes we will be making, so that users know what to expect.

Andrew Walton is Assistant Deputy Director National Accounts Co-ordination Division

Sumit Dey-Chowdhury is a senior economist at the ONS.