Public services: measuring the part they play in the economy through the pandemic

The coronavirus (COVID-19) pandemic has clearly hit the economy of all countries very hard, with big falls in GDP across the world. The UK has seen the output of its public services, such as health and education, hit harder than many other countries. Here Rob Kent-Smith explains how we measure the contribution of these important services and why we’ve seen such big declines.
Throughout the months of lockdown, GDP recorded its biggest ever falls since figures were first published way back in the 1950s. One area that has been particularly hit is public services, with the ‘output’ of education and health down a lot further than in some other countries. Output shrank rapidly as schools closed and as hospitals reduced elective and outpatient activity in the wake of the pandemic.
In many countries they measure the contribution of health and education to GDP by looking at the inputs; the wages or hours worked by teachers and nurses and other costs such as medical equipment. However, in the UK we measure the contribution of these services by directly counting these activities: for example how many GP consultations and operations have taken place, or how many children have been taught.
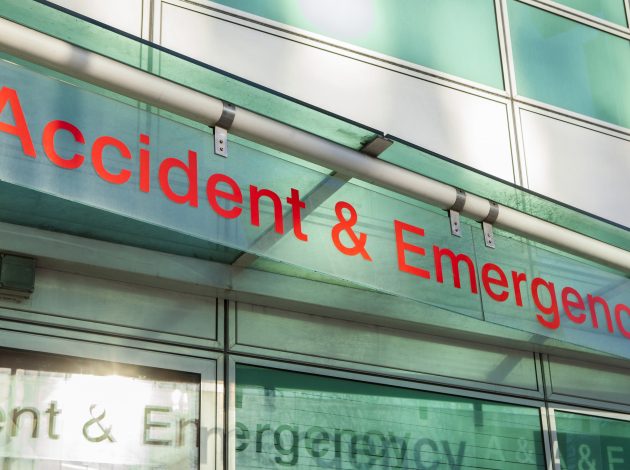
As the amount of worker time and staff costs in public services has not fallen in many countries, those which base their estimates on these data are likely to show relatively stable levels of output. However, due to school closures and a fall in the number of people having elective surgery and visiting Accident & Emergency units, our estimates show a much larger fall. For example, data from NHS England show that A&E visits were down 30% in July compared with the same time last year.
Our method of directly measuring the output of public services paints a more accurate picture than simply looking at the costs. However, this does make it harder to compare our figures with other countries who base their statistics on the wages of workers and the costs of materials.
We have worked closely with the Department of Health and Social Care, the Department for Education and the devolved administrations to ensure that we reflect what is happening on the ground in our public services as closely as possible. This has included adapting and improving our methods to reflect the unique circumstances and, in some cases, collecting new data. To capture changes in education output, for instance, we commissioned new collections through ‘Teacher Tapp’ – a survey run by Educational Intelligence Ltd – which allowed us to ask teachers directly about how much time they are spending teaching compared with normal. This allowed us to account for the children being taught, both in schools and remotely.
These changes have not been straightforward. One issue that we need to grapple with in the coming months is how to measure education output in the school holidays. While very few children will have been educated in the summer holidays, the number will be in line with what we would normally expect. This means that, because our data is seasonally adjusted, we would expect education output to be higher in the summer holiday period than it has been over recent months.
One other area people have queried is the gap between ‘cash’ and ‘real’ GDP: in much of the economy, in the short term, we measure the turnover of a business to produce cash GDP, and then adjust for changing prices to achieve real GDP.
However, with public services, we measure cash output by looking at the total costs – such as wages – while our real estimates are based on children taught and operations undertaken. Because of this in recent months the gap between our cash and real measures of output have grown substantially.
COVID-19 has thrown up many challenges across our society and economy. While our figures may be open to more revisions than usual, we are confident that they give good estimates of the pandemic’s impact on the amount of activity delivered by our important public services.

Rob Kent-Smith, Head of GDP