How am I represented in Census 2021 data?
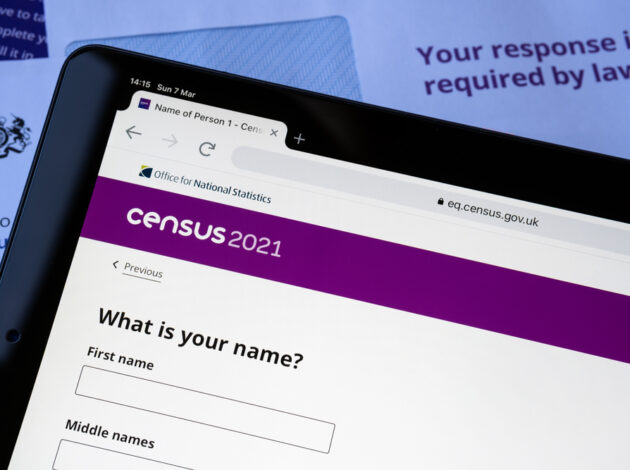
Census 2021 was the most inclusive ever. People could identify as they wished, using online search options and paper write-ins and respond on a tablet, computer, phone or a traditional paper form. But how is data on the myriad ways people chose to identify being turned into meaningful statistics? Ahead of the census ethnic group, national identity, language and religion topic summary release, Sarah Wood explains more.
Write-in answer boxes and search-as-you-type functions meant everyone could answer census questions as they wished in March 2021. For all the identity questions, people could select one of the tick-box options or write in their answer – making census more inclusive than ever before.
We are publishing census data on everyone in England and Wales. Everyone’s write-in answers are included in our statistics but not every write-in answer is published.
Taking the religion question as an example, if you chose to use the “Any other religion, write in” box to answer rather than one of other 7 tick-boxes – No religion, Christian, Buddhist, Hindu, Jewish, Muslim, Sikh – what will you see?
As you will see next week, we have been able to build a detailed religion dataset (tables of the latest census statistics) providing insights into 50 additional groups (as well as the 7 groups in the religion tick-box dataset).
Building a detailed dataset for publication
There were hundreds of different write-ins, so how did we decide on 57 religious groups?
First, write-in answers are grouped together based on sense and spelling checks. Write-in answers from the online and paper questionnaires are treated the same.
So, for example, two different names for one religion or ethnicity will be grouped together in one category. These categories are the building blocks for the data we publish.
For example, three different Write-ins: Rasta, Rastafari, Rastafarian are all categorised as ‘Rastafarian’ and will be published in ‘Other religion: Rastafarian’.
For the religion question, the hundreds of thousands of write-in answers were grouped into 144 different categories.
Most of the write-in answers that make-up these categories are denominations or branches of the ‘tick-box’ religions. These categories are grouped together along with the tick-box answers. So, if you wrote ‘C of E’ into the ‘Any other religion write-in’ box, this would be grouped into the ‘Church of England’ category and then into ‘Christian’ in our published dataset.
To decide on the additional categories beyond the 7 that were tick-boxes, we looked at the following factors in combination:
- the categories published for the 2011 census data (to help with consistency for comparing data between censuses)
- new user needs (identified through stakeholder engagement and a public consultation)
- the number of people within the category (to check we can ensure confidentiality in our published data)
As a result, Census 2021 enables us to provide insights into lots of different identities and groups taking into account user need and changes in society, whilst keeping the data consistent and comparable across time.
What about our other statistics?
It’s a similar story for our ethnic group data also being published next week.
We record every response provided to the ethnic group question, either through tick-box selection or write-in. Sometimes there were not enough people identifying in a particular way for us to include it in our published datasets while ensuring confidentiality. In these cases, we have grouped them together where appropriate, or included them within ‘Any other ethnic group’.
From these many write-in answers, we have built a detailed ethnic group dataset that provides insight into 287 ethnic groups. As a result, some aspects of someone’s ethnic group may appear multiple times.
For example, “Portuguese” could appear in the detailed classification as “Black, Black British, Black Welsh of African or Caribbean background: Portuguese,” or it could also appear in “Mixed or Multiple ethnic groups: Portuguese”, “White: Portuguese” or “Other ethnic group: Portuguese”.
The ethnic groups with too few write-in answers for us to publish and ensure confidentiality are grouped together as “any other ethnic group” under their respective high-level ‘tick-box’ categories. For example, if there were very few people who identified as “Portuguese” within the “Asian, Asian British or Asian Welsh” ethnic group, they would need to be aggregated with other small groups in the “Asian, Asian British, Asian Welsh: Any other ethnic group” category.
Why we don’t just publish every write-in answer
We record every write-in answer, but we don’t routinely publish counts of them because write-in counts are not population estimates.
Write-in counts do not represent the number or proportion of the population as a whole who identify with that religion or ethnic group. For instance, the write-in count for the number of Catholics may not represent the overall population estimate of Catholics because some Catholics may have described themselves as “Christian”. Or people who identify with the same national identity may, for example, respond with different names, spellings, or variations of that national identity.
Even with similar responses aggregated, these counts are not how we present the final census data.
The numbers we publish in our datasets are population estimates. To produce population estimates, individual answers to census questions are collated, categorised and a number of additional statistical processes are applied to adjust for people who did not respond to the census and to ensure confidentiality.
Everyone is included in the data we publish
Finally, it is important to remember everyone is included in the data we publish. If too few people answer in the same way for that identity to appear as a population estimate in our datasets, those answers will be grouped with other small counts and included that way.
Every write-in answer counts, and everyone is included in the data we publish.
The first snapshot of ethnic group, national identity, religion and language from Census 2021 is out next week, with more detailed data and analysis on these topics being published in the coming months, alongside the release of multivariate data. Read more about our ethnic group, national identity, language and religion analysis plans and the release plans for Census 2021 more generally.

Sarah Wood is ONS’ topic lead for Ethnicity, National Identity, Language and Religion