
Measuring labour productivity: our new approach

Today the ONS has published a research paper setting out an improved approach to estimating labour productivity that uses the best aspects of our various measures of the labour market. The new component method, part of our wider economic statistics recovery plan, has been developed with users and stakeholders to shed light on the ‘productivity puzzle’. Cliodhna Taylor explains how our new approach was put together and how it has improved our understanding of productivity growth.
For many years leading up to the global financial crisis, labour productivity – which is defined as gross value added (a similar measure of the economy to GDP) divided by the labour input across the economy – grew steadily at just below 2% a year per worker, or around 2% a year per hour worked. Then, from 2009 to 2019, our original estimates showed productivity growth slowed markedly, falling to less than 1% a year on average on both a per worker and per hour basis.
There has been widespread debate for many years about this ‘productivity puzzle’, which has been seen around the world, but was more pronounced in the UK. People have debated whether the cause was down to falls in investment or some other change in businesses practices, whether there has been a failure to properly account for the impact of new technologies, or other measurement issues.
Our new component-based method improves our estimate of both the number of workers contributing to UK output and the number of hours they work. Whilst it does not materially change our account of the slowdown in output per worker, there is a material change to why this occurred. We now think more of the slowdown can be explained by continued falls in average hours worked, leaving less to be explained by falls in output per hour.
Under the new approach, it remains clearly visible in the data that, following the 2008 financial crisis, the UK experienced a slowdown in productivity growth per hour compared with the historic long-term trend.
Just as importantly, none of our changes today impact GDP. All the numbers being presented are fully consistent with the Blue Book 2026.
Today’s figures cover the period from 1997 to 2024. We will publish data right up Q2 2026 later this year, once this year’s annual GDP dataset is published, at which point the results of the new method will be incorporated into headline productivity data.
The changes being made
We have been clear and open with users that our previous headline measure of UK labour productivity, based on the Labour Force Survey (LFS), faced challenges due to the previous low response rates that have been well-documented. In August 2024, we started to publish a second, experimental, approach to measuring productivity using HM Revenue & Customs (HMRC) payrolled employee data and recently recommended that users focus on this approach as a transitional series of how productivity is changing in the UK economy.
Part of the reason for this is that the measure of employment under the LFS had been affected by changes in the quality of the survey, which depressed measured employment growth in the run-up to the end of 2023 and then lifted employment growth over 2024 and 2025 as the improved survey became better at finding employed people. This meant that the productivity growth figures based on the LFS were stronger in the run up to 2023 but weaker in the following two years.
Concurrently, we have been looking closely at our methods, learning from international best practice and working with experts on an improved approach, which will be introduced from the November 2026 quarterly bulletin. The new ‘component’ method to measuring labour productivity builds on 2018 research by the OECD which was funded by the ONS, alongside joint research between myself and Josh Martin from the Bank of England, showcased at the May 2026 Economic Statistics Centre of Excellence (ESCoE) conference. Whilst this process has taken time, we have used the period to widely discuss the rationale behind these revisions with key users and have worked to take on feedback.
The improved methods contain two key aspects: firstly, updating the method to estimate the number of jobs and secondly updating how we estimate the number of hours worked per job.
The number of jobs is now based on the ONS’s published Workforce Jobs series, which better matches the concept that productivity is trying to focus on; those who work in the UK economy rather than those resident in the UK. Worker estimates are then derived from these jobs numbers by accounting for second, third, and subsequent jobs. The resulting output per worker estimates display trends similar to those seen in the PAYE RTI based output per worker estimates, which we recently established as our headline indicator. The research to develop these RTI-based estimates, and the lessons learned from their interpretation, have been core parts of developing this aspect of our new methodology. This triangulation of multiple data sources is a key strength of this new approach.
Some of the issues addressed in these improvements have been well-known in theory for a long time and formed a strong part of the case to improve the LFS. The work to develop the Transformed Labour Force Survey (TLFS) has reaffirmed the importance of these methodological issues in terms of the data. Key among these for productivity analysis is how the average number of hours worked has previously been calculated ‘directly’ from responses to the LFS, where we ask those interviewed how long they have worked in the previous week. When we looked closely it became clear that these data contained upward biases: firstly people can find it hard to recall their actual hours worked and may lean on their usual or contracted hours to shape their answer. Secondly, this can be especially true if the individual responding for the household is answering from other household members. Thirdly, the LFS is a survey people reply to in several waves. When people miss out data or don’t reply to a follow-up we often impute a value from their previous responses. However, if the individual went on holiday and didn’t respond to the survey, rather than impute their responses (showing them working the same as usual), we needed to record a lower number to reflect they are away from work. Together these biases lead to an over-estimation of average hours worked per week and so the total number of hours worked overall. As over time we saw a fall in responses to the LFS, the scale of this upward non-response bias increased. This is partially why the UK experienced lower productivity growth than comparator countries.
Whilst we have improved imputation in the TLFS, to comprehensively address this and similar issues we have developed a new ‘component approach’ to measuring hours worked, drawing on international guidelines and utilising the best available information for each of our data sources. For the new improved method, we take the total number of usual hours per job from the large ONS Annual Survey of Hours and Earnings (ASHE) and deduct the total number of hours of leave using the amount of leave people tell us they are entitled to from the LFS as well as adjustments for all other reasons hours may vary from usual, such as unpaid overtime and sickness. We then sum this up using the total number of jobs per industry, based on data from the large annual Business Register and Employment Survey (BRES) and the quarterly business surveys that drive Workforce Jobs.
The new improved figures show falling average actual hours worked per job and slower growth in total hours worked since 2008, and consequently higher growth in productivity per hour. Our previous estimates suggested UK labour productivity per hour grew at an average annual rate of 2.1% before 2008 and 0.7% thereafter. Today’s improved estimates indicate that productivity grew a little slower before 2008, at 2.0%, while it grew at an average of 1.3% from 2009 to 2019.
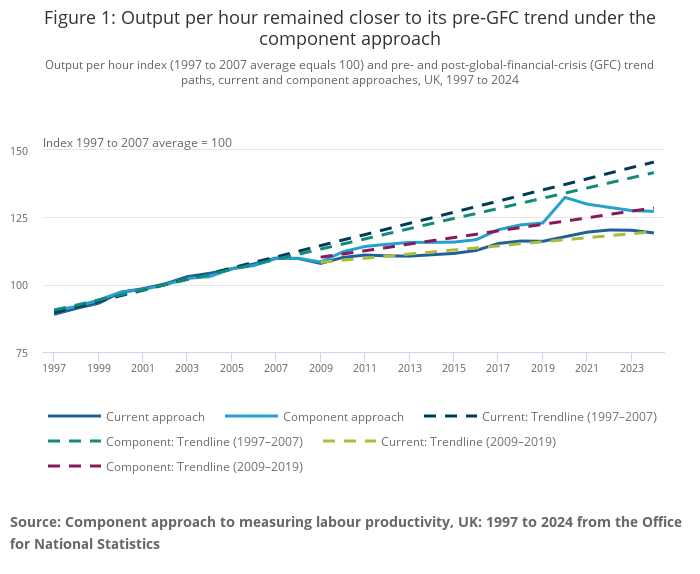
The data for this chart can be downloaded in Excel here.
Therefore, while the measure of the slowdown in output per worker is largely unaffected, today’s estimates reduce the size of the productivity slowdown by around half. However, overall, the “productivity puzzle” remains, albeit more muted than before, as these data still point to a fundamental shift in the UK economy following the financial crisis.
Introducing the changes
Initially these improved numbers will only be available at a whole economy level, but throughout next year we will roll out improved estimates for industry level productivity, and subsequently sub-national level data. These data will be vital in providing more accurate ways to understand how technology, such as artificial intelligence, is driving change across different industries, and how different areas of the UK are performing relative to one another.
Today’s numbers produce an important shift in the quality of the UK’s productivity data. They form part of our wider workplan to improve the quality of the UK’s economic statistics, to ensure policymakers have the best possible information when taking important decisions about our economy and society – including the scale of the productivity puzzle.

Cliodhna Taylor is head of Productivity Statistics at the Office for National Statistics.