Housing costs: How we measure them and why
The various housing costs people face have been a hot topic for a number of years. Here Chris Jenkins looks at the various sorts of costs, how ONS goes about measuring them and what they show.
Housing costs are important. Typically housing, whether you are looking at the cost of purchasing a house or measuring the costs associated with owning, renting or living in a house, represents some of the most expensive outgoings we all face.
If someone is interested in the cost of purchasing a house, then the UK House Price Index will provide an estimate of the average price and how that has changed.
As the cost of living in a property one owns is different to the cost of buying one, the measurement of such costs (referred to as owner occupied housing[1]) is somewhat more difficult, as described recently by Jonathan Athow.
The approach we favour for measuring owner occupied housing is known as rental equivalence. The rental equivalence approach assumes that the rent paid for an equivalent house can be used as an estimate of the cost living in that house. It can be seen as a so-called ‘opportunity cost’, which looks at how much rental income an owner could get from their home if they were not living in it. For this rental equivalence approach, a comprehensive and robust source of rental price data is required and ONS makes use of over half-a-million prices, provided by the Valuation Office Agency in England, Rent Officers Wales in Wales) and Rent Service Scotland in Scotland.
Such a robust source of rental data also allows ONS to produce a separate measure of how much rental prices themselves have changed, which we publish in the Index of Private Housing Rental Prices (IPHRP).
Given that both owner occupied housing costs and rental prices are constructed from the same source of data, one could reasonably expect them to show the same price development over time. Whilst they are very similar, there are some very sensible reasons why they should differ.
Figure 1: 12-month growth rate for IPHRP, England and OOH, UK, January 2006 to August 2018
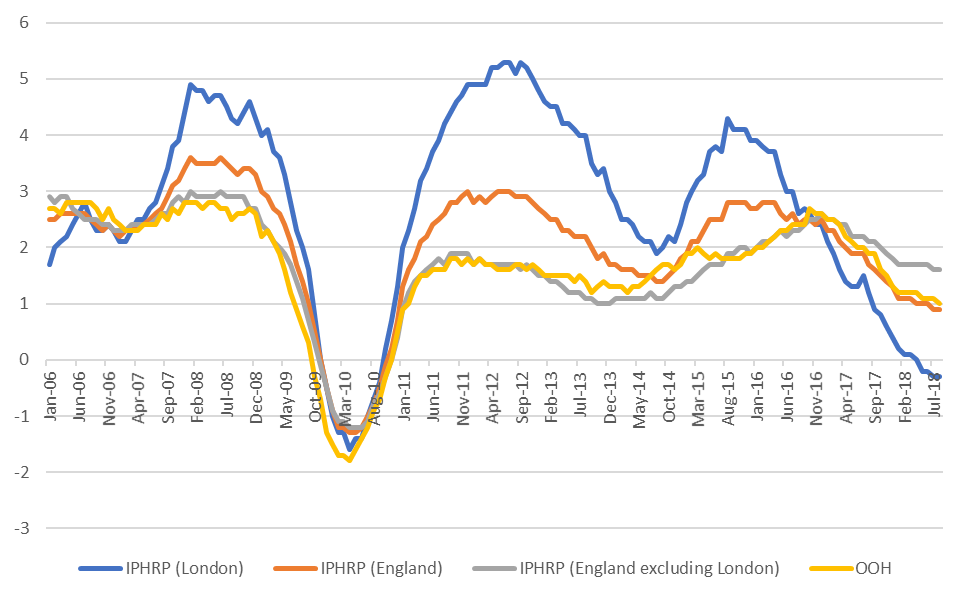
Source: ONS
The main reason for the difference comes from the different housing mix that represents the private rented sector compared with the owner occupied sector. The type and location of properties in the private rented sector are different to the owner occupied sector, and we take this into account when calculating our headline estimates. If we just consider location as an example, London has a smaller proportion of total owner occupied homes, compared with privately rented homes. This means that London will have more of an impact on rents (which is weighted to reflect the private rented sector) than owner occupied housing (which reflects the stock of owner occupier housing). This impact is evident in Figure 1, which shows the historic growth in London private rental prices compared with IPHRP[2] (for England and England excluding London) and owner occupier housing. Most telling is the comparison of IPHRP excluding London and owner occupier housing, which are almost identical, highlighting the impact London is having on the IPHRP.
Figure 2 provides an indication of how the proportion of owner occupied and private rented stock differs for London, with private rented stock being much larger.
In this year, London accounted for 21% of England’s private rented dwelling stock but only 11% of its owner occupied dwelling stock. This illustrates how London would impact the private rent series (IPHRP) more than the owner occupier housing series.
Figure 2: Dwelling stock proportions, by tenure for London
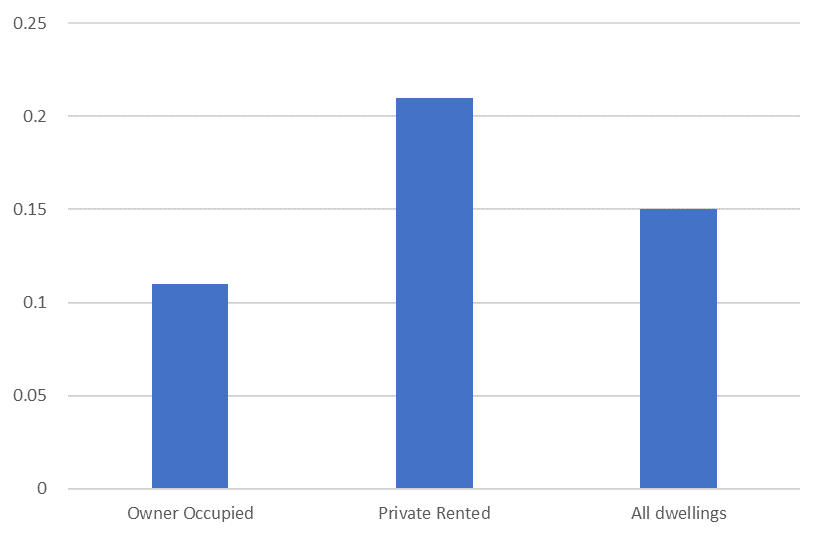
Source: Ministry of Housing, Communities and Local Government
The measurement of owner occupied housing costs is very important for ONS as we use them in our most comprehensive measure of consumer price inflation, the Consumer Prices Index including owner occupiers’ housing costs (CPIH), with owner occupied housing costs representing approximately 20% of the index.
Essentially, CPIH is the same as the Consumer Prices Index but with both owner occupiers’ housing costs and Council Tax, making it the most comprehensive measure of price change across the economy as a whole, and the lead measure in our publications.
We have also been looking at why our rents figures can be different to other measures of private rents and have been publishing a regular release looking at the differences. In short, other rent measures tend to focus only on those new lettings made in a month while our rent measure considers the whole stock of rentals: both new lettings and those in an existing contract. Different approaches yield different results but if you compare measures on a consistent basis, then you get much more similar results.
Figure 3: Index of Private Housing Rental Prices and Countrywide occupied lets percentage change over 12 months, January 2014 to May 2017, UK
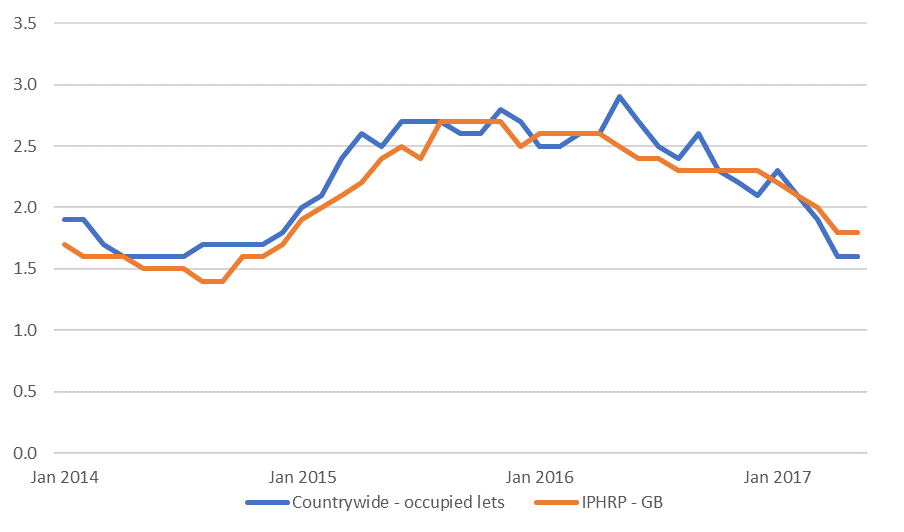
Source: ONS, Countrywide plc
Measuring the costs of buying, owning and renting a home can be a complicated process, but we’re confident we’re measuring these costs in the best way possible to produce the figures we all need to see how our society and economy is changing.

Chris Jenkins is a senior inflation Statistician at the Office for National Statistics
[1] Owner occupied housing is property lived in by people who have bought them (or are in the process of buying), rather than people who pay rent
[2] England IPHRP series is used for comparison in figure 1 as this data is available from 2005. The GB IPHRP series is only available from 2011