Shopping may never be the same again
The coronavirus (COVID-19) pandemic has changed many elements of our everyday lives, including how we shop. The introduction of movement restrictions meant the closure of most physical shops, so many consumers have been doing their shopping from home instead. In May 2020, over a third of retail spending was online – the highest ever share. In this blog Josh Martin takes a closer look at the online retail sales data to understand this trend.
In the world around us the economy is becoming increasingly digital, but it may surprise you that in 2019 only 19% of retail spending was online. ONS publishes data on retail sales every month, which shows the increasing proportion made up by online sales. In these data, retail sales only includes spending with businesses selling mainly physical goods for the consumer and home. Services such as holidays and music downloads, by definition, are not captured in the ONS retail sales.
The online share of retail spending jumped to 33.4% in May 2020 – the highest on record.
While it took 7 years to get from 9% to 19% (2012 to 2019) it took only 4 months to get from 19% to 33% (Jan 2020 to May 2020). Business expert Theo Paphitis has suggested that the pandemic has accelerated the move online by up to 5 years. Other countries have seen similar phenomena, although data on online retail is rarely available monthly, online retail in the US is thought to have jumped over 20% in April year-on-year, although their official data is only released quarterly. Research also indicates a big jump in online spending in Spain at the end of March.
Figure 1 – Internet sales as a share of all retail sales, monthly, Jan 2012 to May 2020
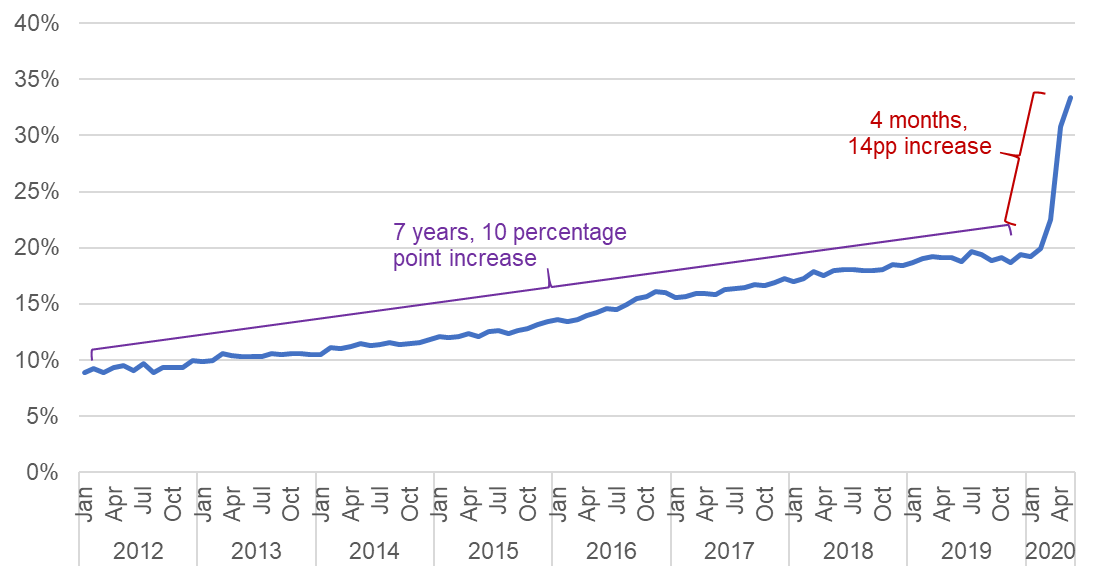
Source: Office for National Statistics – Retail Sales Index
However, this increase in the online share also came at a time when retail spending fell by a record amount overall – by 19% in value terms in April 2020, and despite a partial rebound in May, remains 14% down on pre-pandemic levels. So while online spending went up in value terms, the online share was also a fraction of a smaller total.
The increase in the online share from 19% in 2019 to 33% in May 2020 is partially due to increased online spending, and partially due to falling total spending. The chart below shows how these two factors have affected the online share since the start of 2020. Most striking is that in May 2020, despite a month-on-month increase in total retail values (excluding fuel) of 10%, the online share still grew, as online sales values rose by more (20%).
Figure 2 – Month-on-month growth of online retail sales and all retail sales (excluding fuel), value (seasonally adjusted)
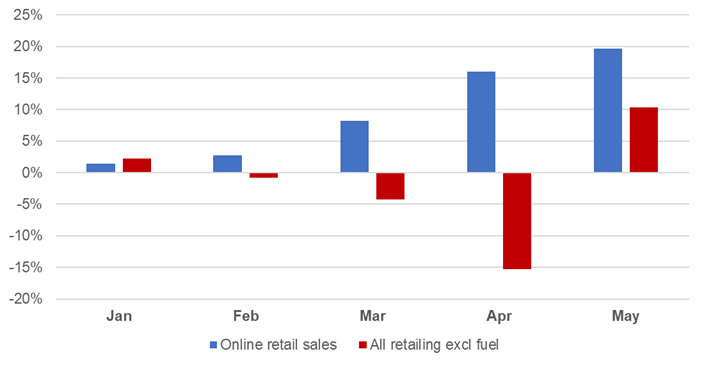
Source: Office for National Statistics – Retail Sales Index
Why isn’t even more spent online? Usually food stores make up about 40% of total spending excluding fuel, but only about 5-6% of that is online. Even though the online share roughly doubled at those food stores between March and May 2020, to over 11%, that’s still a lot of spending in stores. The same is true, to a lesser extent, in other types of store as well – we found in previous analysis that 83% of people reported preferring to shop in store as the reason for not buying goods or services over the internet.
The share of online sales rose in all the major retail categories between Feb and May 2020. It rose proportionately most in ‘other stores’ (pharmacies, technology, books, sports, etc.) – almost quadrupling, although most of this increase was between February and April.
Figure 3 – Relative increase in online share of retail sales, between February 2020 (pre-lockdown) and subsequent months, seasonally adjusted
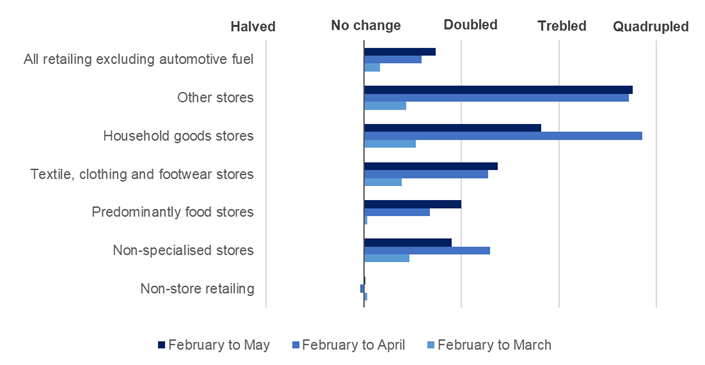
Source: Office for National Statistics – Retail Sales Index
While the pattern of total spending shifted considerably (towards food and non-store retailers, away from everything else), the pattern of online spending didn’t change much, reflecting the fact that most categories saw large relative increases in online spending.
A large but diverse category is ‘non-store retailing’ which covers mail orders, internet sales, markets, and other non-traditional stores. The online share stayed roughly constant at around 80% for this group.
It wasn’t only online-only stores doing well – a wide range of retail businesses saw increases in online sales, across a range of retail categories (Figure 3). Data from the fortnightly Business Impacts of Coronavirus Survey (BICS) shows that over 30% of responding businesses with an online service who continued trading saw an increase in online sales in the last two weeks of May. A further 4% of businesses reported selling goods or services online for the first time during the pandemic.
The latest Retail sales data for June 2020 will be published on Friday 24 July 2020 at 7am. Follow @ONS on Twitter for the latest.

Josh Martin is Lead Analyst for the COVID-19 Response at the ONS