The wealth of regions – measuring the UK’s tax and spending imbalance

Experimental statistics from ONS have suggested that in 2016 only three UK regions generated more in taxes than they receive in public spending. The data have caused a stir in the media with headlines proclaiming that London and its surrounding regions are effectively ‘subsidising’ the rest. Jonathan Athow explains how the figures were calculated and how ONS is looking to develop and improve them.
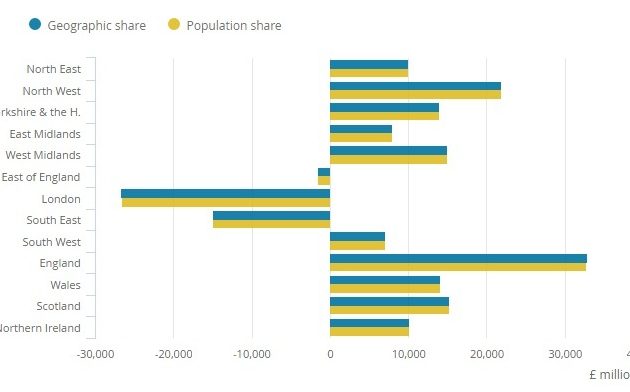
On 23 May, ONS published some new statistics breaking down the public finances statistics for the different countries and regions of the UK. This allocated public sector revenue and expenditure to each country and region, allowing us to see how spending levels and tax receipts vary across the UK. This analysis included an estimate of the ‘net fiscal balance’ for each country and region. That provided an estimate for which parts of the UK contribute more to public sector revenues (mostly taxes) than they receive in public spending or vice versa. The issues of taxation and expenditure are important in the context of ongoing discussions about devolution and relative economic performance.
“The publication of these new statistics shows our determination to develop statistics that provide more granular information on the UK, its countries and regions”
This exercise is quite challenging, and I will just set out some of the statistical and data issues that needed to be confronted. Luckily, we did not have to start from scratch and were able to draw on the work of others, notably the Scottish Government, HM Revenue and Customs, HM Treasury and Northern Ireland Statistics and Research Agency.
Where is money spent?
In some cases it is quite easy to see how taxes and public spending should be allocated across the country. For example, paying the State Pension to someone living in the East of England means we should allocate that spending to that region. Likewise, if that pensioner pays income tax, the revenue should also be allocated to that same region.
There are, however, some expenditure items where the allocation is much less straightforward. For example, how should defence spending be allocated? We do not allocate it to where military bases are located, but rather think of the outcome of defence spending, which is protecting the nation. We therefore allocate an equal amount of spending to everyone in the country, following the idea that everyone benefits equally from this protection (in economic terms, defence spending is a ‘public good’).
Where is tax raised?
On the tax side, there are also conceptual challenges. We allocate income tax by where someone lives rather than where they work. So someone who lives in Bristol but works in Newport in Wales would have their income tax allocated to the South West of England rather than Wales. Many regions have little commuting between them, so these commuting flows are not that important, but for London in particular, this effect is significant.
While this approach might not strictly follow the economic activity, it does help better link taxes with spending. After all, people tend to consume public services such as schools where they live.
There are also some significant challenges on the data side, many stemming from the way in which taxes and spending are administered. As an example, while VAT is included in the prices of many goods and services we buy, it is paid to the Exchequer by companies. A large retailer might have hundreds of shops each charging VAT, but may make only a single payment of VAT every month. It is therefore not possible to know how much of that VAT has been collected from a particular place. This gets more complicated as many companies can reclaim VAT on goods and services they use, which might have an entirely different geographical pattern.
Here we cannot use administrative data to allocate receipts between regions. So VAT is allocated according to the share of spending liable to VAT measured in the Living Cost and Foods Survey, which provides estimates of household expenditure and consumption across the UK. Likewise, corporation tax is allocated according to the proportion of employees working in each region, where data are available.
Developing and Improving
The figures published on 23 May are experimental statistics, meaning they will be improved and user feedback sought. There is a clear interest among the public and decision makers in these data and the statistics we published represent our best view of this important, but challenging to measure, issue. The conceptual and data limitations mean we will always need to make assumptions and estimations, but that does not mean we cannot look to develop those assumptions and estimates.
The publication of these new statistics shows our determination to develop statistics that provide more granular information on the UK, its countries and regions. To further improve these statistics we will run a formal consultation seeking views on the methodologies employed in our May publication as well as on the presentation of those estimates. Alongside the consultation, we we will offer a study of public sector revenue and expenditure that are available at smaller geographic areas than those currently used in the country and regional publication. We look forward to hearing the views of users on these topics.

Jonathan Athow is Deputy National Statistician for Economic Statistics