Beyond GDP: Measuring the economic well-being of individuals

The ONS economic well-being indicators are designed to show the changing economic fortunes of individuals as opposed to the that of the economy as a whole. Here, Dominic Webber and Sophie Warnes introduce the new economic well-being dashboard.
We have launched a new economic well-being dashboard alongside our regular quarterly bulletin, to highlight the different indicators that can be used to assess the health of an economy. It is designed to look beyond traditional measures like Gross Domestic Product (GDP).
We are always looking for ways to improve our statistics, and this area is one where we’re keen to develop new ways of thinking about how we measure individual progress and welfare. As renowned economist Joseph Stiglitz wrote: “In many cases, GDP statistics seem to suggest that the economy is doing far better than most citizens’ own perceptions. Moreover, the focus on GDP creates conflicts: political leaders are told to maximise it, but citizens also demand that attention be paid to enhancing security, reducing air, water, and noise pollution, and so forth – all of which might lower GDP growth.”
GDP has been used to measure the size and health of a nation’s economy since the 1940s. People have often tried to use GDP as a proxy for living standards and economic well-being even though it was never designed to be used this way. Even Simon Kuznets, one of the pioneers of measuring GDP, was aware of its limitations. Kuznets said GDP doesn’t give a complete picture of the national economy and that a rise in GDP doesn’t always mean that the people in that country are better off as a result. Robert Kennedy also noted in 1968 that GDP measures everything “except that which makes life worthwhile.”
The limitations of GDP
There are a number of reasons why GDP is, at best, limited as a measure of welfare. First, it focuses solely on the value of goods and services produced each year, and an increase in this doesn’t necessarily lead to a proportionate increase in the well-being of individuals. Second, it doesn’t fully take into account things like social, natural, or human capital – things which all improve our lives and contribute to our happiness and health.
This means that a focus on GDP growth may encourage activities which negatively affect well-being in the long term, such as the depletion of natural resources faster than they can be replaced.
Additionally, GDP doesn’t count hours spent on unpaid work like volunteering or caring – things which are important for us in other ways, and which contribute billions to the economy.
New measures of economic well-being
ONS now publishes a quarterly economic well-being bulletin, alongside more traditional measures of the economy, to help explain how households are progressing.
Three of the main indicators – GDP per head, national income per head (net national disposable income per head), and household income per head (real household disposable income per head) – tell a different story about growth in the UK, and offer a more holistic view of economic well-being.
Figure 1: GDP compared with 3 measures of economic well-being, 2008 Q1 – 2017 Q1
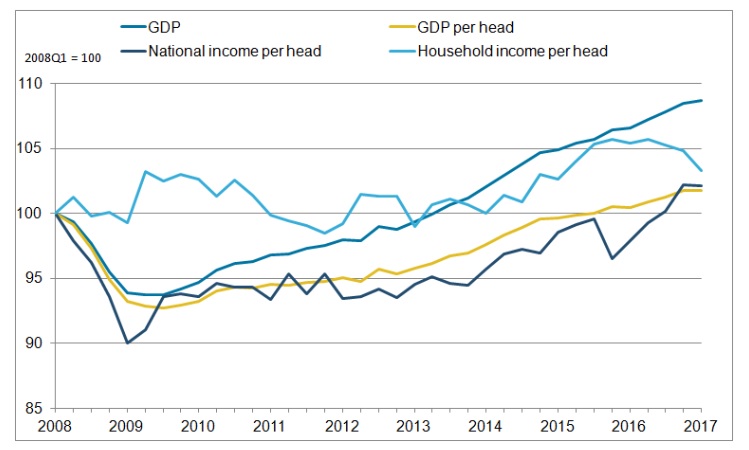
GDP per head
GDP per head is also known as GDP per capita or per person. It’s affected by population growth, so if both GDP and the population increase by 2% year-on-year, the increased income is cancelled out by population growth.
While GDP alone reached its pre-recession peak in the third quarter of 2013, it took another two years to reach the same level when measured as GDP per head.
Just by taking into account population growth, we can see how just looking at GDP can provide a misleading account of how well-being has changed in the UK.
National income per head
Income tells us more about what people can buy, which is linked to how happy people are.
While GDP tells us about the income earned from producing goods and services within the UK, it doesn’t take into account income flows into and out of the country. This income is in the form of foreign investment in the UK, and UK investment abroad.
Where a British national owns a company abroad, for instance, this income is not counted as part of UK GDP, whereas that income would likely be spent in the UK. Conversely, foreign-owned company income is counted as GDP, but does not always end up remaining in the UK. National income takes these income flow differences into account.
National income per head has grown much more slowly than GDP per head since 2011, but the most recent data shows a slight reversal of this trend. This is due to two main factors – firstly, mostly due to falling earnings for UK residents from investment abroad, and secondly, because of an increase in foreign earnings on investment in the UK.
Household income per head
The household income per head indicator takes into account the fact that not all national income ends up in households – some goes to the government through taxation, and some goes to corporations as a profit.
Income for households is made of two main components: primary income (wages, assets), and net transfers (internal redistribution of income, such as benefits).
But household income as an indicator is also affected by prices – as prices rise, every pound buys a little bit less, and therefore our income falls in real terms.
Changes in household income tell a remarkably different story to other indicators.
Cumulative contributions to growth in household income per head compared to Q1 2005, Q1 2005 – Q1 2017
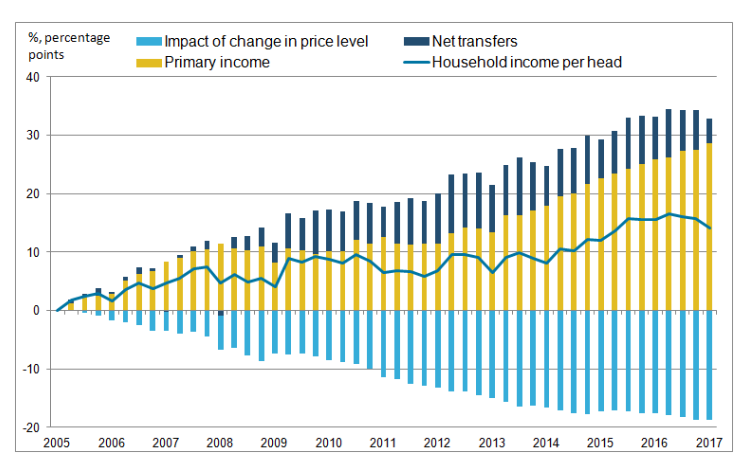
Household income per head rose by 14% between 2005 and the start of 2017. Growth before 2008 was largely due to primary income increasing, during a period of relatively strong economic growth.
Following the recession, economic activity weakened, as did earnings. Net transfers – redistribution via taxes and benefits – plugged this shortfall, and the role of net transfers became more important.
Effectively, after the recession, the amount in benefits that households received grew at a faster rate than the taxes they paid, so household income remained stable during difficult economic conditions.
More recently, household incomes have been supported again by primary income.
The UK has experienced positive inflation since 2005, and therefore the value of household income has eroded over time. But the inflation rate was not high enough to offset the rise in both primary income and net transfers. Therefore household income per head still grew by an average of 0.5% per year since 2005.
While GDP is a globally recognised indicator of well-being, these three indicators are just three of around 10 indicators that ONS is monitoring as an attempt to get a more rounded view of the economy. For a more complete picture, which includes unemployment, wealth, and spending, the latest bulletin can be found here >
Dominic Webber is Head of Economic Well-being
Sophie Warnes is a Senior Data Journalist