Understanding the full business impact of the coronavirus pandemic

Statistics on the number of business creations and closures are important indicators of the health of the economy. However, the different measures of creation and closure can paint a complex picture. Josh Martin describes some new ways we’re measuring this important metric to support understanding of the longer-run impact of the COVID-19 pandemic on the economy.
While there are now some early signs of recovery, the longer-term economic impact of the pandemic remains far from certain. Business dynamism – a collective term for a range of factors relating to the opening, closing, and growth of businesses – is an important topic associated with innovation, productivity and economic growth. A steady rate of business creation and business closures is normal for an economy, as it allows new ideas to flourish and the economy to grow.
New businesses are thought to be generally more innovative than existing firms, bringing new ideas to the economy and often growing rapidly. As a result, a decline in new business start-ups may indicate a decline in the acceleration of new ideas in the economy, limiting future economic growth.
Business closures are often painful for workers and owners and cause a loss to the economy in the short term. From a macroeconomic perspective, some business closures can be seen as positive; if an unprofitable or unproductive firm shuts down, it makes space for new, more productive businesses. The unusual circumstances of the pandemic may lead previously profitable businesses to cease trading, potentially breaking important links in supply chains, and leading to longer-term damage to the economy.
The uncertainty caused by the pandemic means it may be a difficult time to start a new business, and therefore many commentators have expected new business creation to fall. Meanwhile the challenging economic circumstances may also lead to an increase in business closures.
How we are measuring business dynamism during the pandemic
Today the ONS has launched two new sets of statistics better to understand business dynamism in the UK, in order to track the impact of the pandemic on the longer-term health of the economy.
In collaboration with Companies House, we have begun publishing weekly indicators of company creations and closures in our ‘Faster Indicators’ publication.
We have also published new quarterly estimates of business creations and closures from the Inter-Departmental Business Register (IDBR), which captures all businesses registered for VAT or PAYE, up to the end of June. These include, for the first time, estimates of the turnover and employment of the businesses that were removed from, or added to, the IDBR.
What we mean by a ‘company’ or a ‘business’ is different across these sets of statistics, and different types of closures are covered in each; we have explained all about these differences in this methods note.
The weekly data show that company creation slowed during April and May this year. This is also consistent with our monthly indicators of ‘new VAT reporters. However, the weekly indicators show an increase in company incorporations in June, such that the total for Quarter 2 2020 is in line with previous quarters; this trend continues in July. As the Companies House register also captures single-person limited companies, which are often below the VAT threshold and therefore will not be on the IDBR or in the VAT reporters index, this suggests that the recent growth in company creation may be from these very small companies.
Various measures of business creation, indexed to Quarter 1 2019 = 100
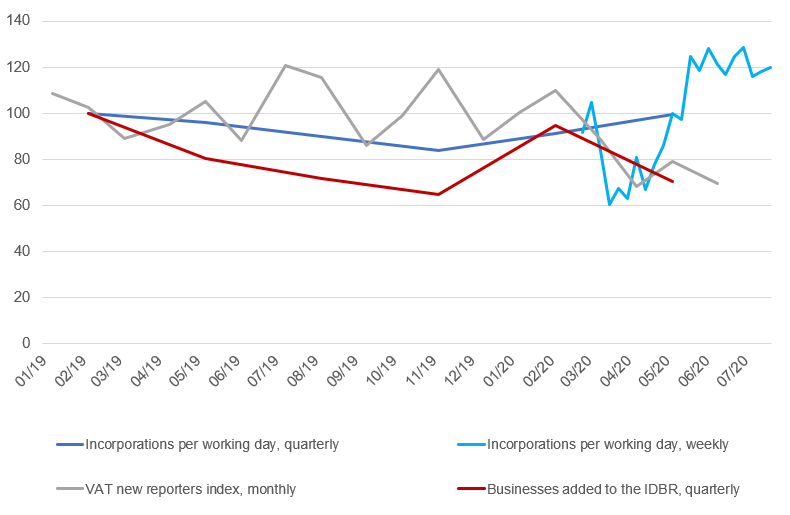
Source: ONS, Companies House, HMRC
Note: Quarterly data plotted in the middle of the quarter (for instance, Quarter 1 data plotted in mid-February); monthly data plotted in the middle of the month
Both the weekly and quarterly data show business closures were lower during Q2 2020 than in previous quarters. Monthly data on insolvencies from the Insolvency Service are also consistent with this trend, although insolvencies typically make up a small fraction of all business closures.
Various measures of business closures, indexed to Quarter 1 2019 = 100
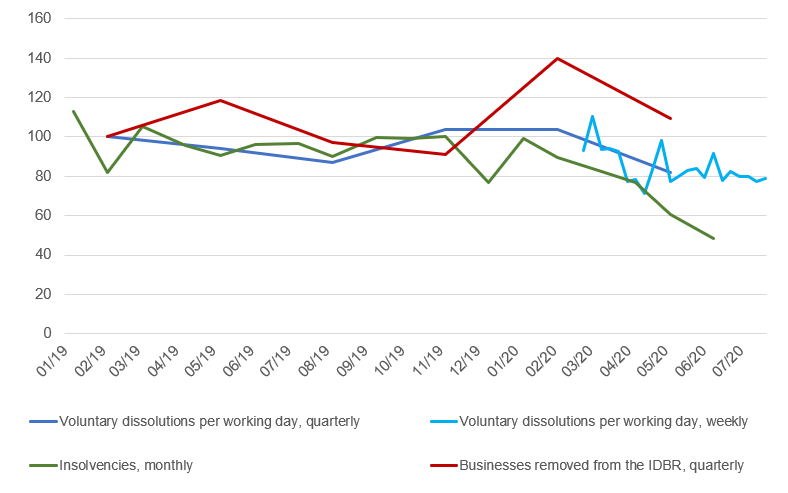
Source: ONS, Companies House, Insolvency Service
Note: Quarterly data plotted in the middle of the quarter (for instance, Quarter 1 data plotted in mid-February); monthly data plotted in the middle of the month
This appears contrary to expectations, as one might expect more businesses to go bust during the pandemic. However, there are a few reasons why we expect business closures to be lower at the moment, as noted by the Insolvency Service: difficulty filing insolvency paperwork due to social distancing measures; temporary easements of normal statutory demands, and filing requirements, allowing companies to avoid compulsory liquidations ; and the government support measures currently in place for businesses.
Additionally, evidence from the 2008-09 economic downturn suggests that even in a ‘normal’ recession business closures tend to peak after the trough in GDP growth. While setting up a company is relatively quick, and so there is little lag on the decline in business creation, closing a business takes longer. The peak in insolvencies was one to two quarters after the lowest point of the recession and remained elevated even after the economy returned to growth.
The increase in insolvencies lagged the decline in GDP during the 2008-09 economic downturn
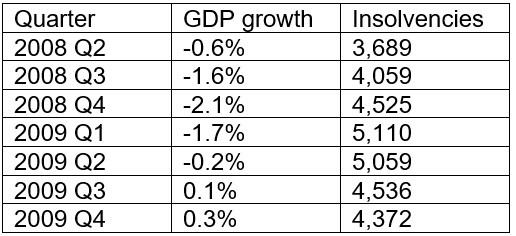
Sources: ONS, Insolvency Service
A test of the ability of businesses to continue to operate will come, as business begin to operate with reduced support measures. Through this period, we will continue to monitor and publish these new weekly and quarterly indicators of business dynamism to monitor this as it happens, helping to ensure the UK has the vital information needed to respond to the impact of the COVID-19 pandemic on our economy and society

Josh Martin is an Economic Advisor for the ONS