Measuring the UK housing market?
House prices and the state of the property market are an abiding national obsession. How much is my place worth, are prices rising around here and can I afford to buy yet? The coronavirus pandemic has made the task of collecting data about the housing and rental markets more challenging, but the ONS and others have continued to produce figures. Here Chris Jenkins looks what they say about the state of the property market in the pandemic so far.
House prices
For most of us our homes will be the biggest purchase we ever make. So we might be forgiven for being mildly preoccupied with their value.
What is interesting (and sometimes confusing) is that properties can have different prices depending on what point in the buy-sell transaction you look at them. In the UK, the sale and purchase of a house is a drawn-out process that can take at least one to three months. At the start of the process, a house will be advertised with an ‘asking’ price. This is the price that the seller expects the house to sell for, or to at least generate interest in the current market.
Then there is then the ‘offer’ price, or the price at which the seller and potential buyer agree to make a deal. It is this offer price that most people then use to arrange finance for the house purchase, typically through a mortgage. As the mortgage proceeds, most mortgage lenders will arrange for the house to be valued, giving rise to a ‘valuation’ price. This valuation is needed to ensure the house represents good and safe business for the mortgage lender.
Finally, once the sale of the house has been finalised, we get the ‘transaction’ price, that is the actual price paid and the one that is recorded on the property registration document. Not all offer and valuation prices will make it through to a final transaction price, and there is also scope for discounting the price at any stage before the final transaction stage.
In the UK we have several house price indices that measure the price at these various points in the transaction process. Given the different points at which these indices are produced, and the different sources of data used, there will quite naturally be differences in the results published. However, taken together they provide a comprehensive picture of the UK housing market:
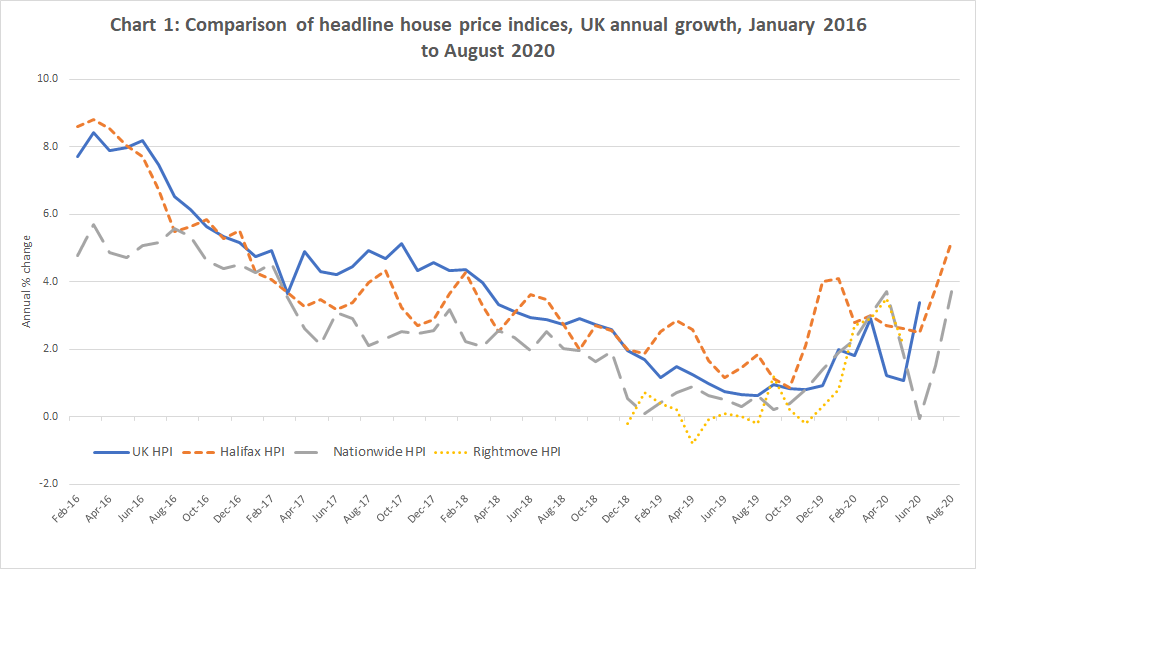
Chart 1 note: At the time of publication, only data for the period November 18 to April 2020 could be accessed for the Rightmove HPI
The Rightmove House Price Index (HPI) measures the asking price of a property providing an early indication of changes in the price and supply of housing to the market. The HPIs produced by Halifax and Nationwide are both based on mortgage approval prices, so these provide an early indication of price change in the market. Finally, our measure, the UK HPI[1], is based on the final transaction price, so this provides a final assessment of what is happening in the housing market using all the transactions that have taken place. Broadly, all measures show the same trend over time although there are fluctuations across the period that reflect the different way each measure is produced.
Covid-19 effected the various housing measures in different ways. Most notably, the lockdown restrictions meant the supply of competed transactions, needed to produce the UK HPI, were limited during the period of lockdown (namely April and May). This in turn meant the production of the UK HPI being suspended. As lockdown restrictions were gradually lifted and the UK housing market opened again, the UK HPI was reinstated and is slowly catching up with its regular production cycle. There is a lot of interest in how Covid-19 may affect the UK housing market. However, it is still too early to make any definitive judgement. It is worth remembering, though, that as the UK HPI is calculated using the transaction price, any post-lockdown impact (i.e. those house sales agreed after lockdown) will not show-up in the estimates until the August HPI at the earliest.
Rental prices
Rental prices are important for ONS as we use them to measure housing costs in the Consumer Prices Index including owner occupiers’ housing costs as I explained in a previous blog. Unlike House prices, rental prices are not a ‘one-off’ purchase. The advertised price can be dynamic and can change quickly to reflect changes in the rental market while an agreed price will remain static for a period of time. Typically, a landlord and tenant will enter into a contract were the ‘agreed’ rent will remain fixed, for say 6-12 months, before the rent is either renegotiated or the tenant moves out and the landlord re-advertises the property.
This difference in ‘advertised’ price versus ‘agreed’ price helps explain the difference between some of the privately produced rental price indices and the government measure, the Index of Private Housing Rental Prices (IPHRP).
The private measures, such as those published by Homelet, Rightmove and Zoopla, are produced using just newly advertised rentals, whereas the IPHRP is produced to measure both the newly ‘agreed’ rents and existing rents. Therefore, IPHRP reflects the stock of rents and not just the ‘flow’ of new rents. A helpful analogy to understand the difference in these measures was introduced by someone who worked at Countrywide rental agency and is based on a bathtub of water.
The ‘newly advertised’ rents are represented by the flow of hot water into the bathtub, while the stock of rents are represented by the water in the tub. The private sector indices will be measuring the temperature of the hot water flowing into the tub, while IPHRP will be measuring the overall temperature of the bathtub. As such, IPHRP will take a bit longer to reflect the change in temperature. Likewise, the IPHRP measure will not reflect some of the volatility seen in newly advertised rental prices. This can be seen from Chart 2.
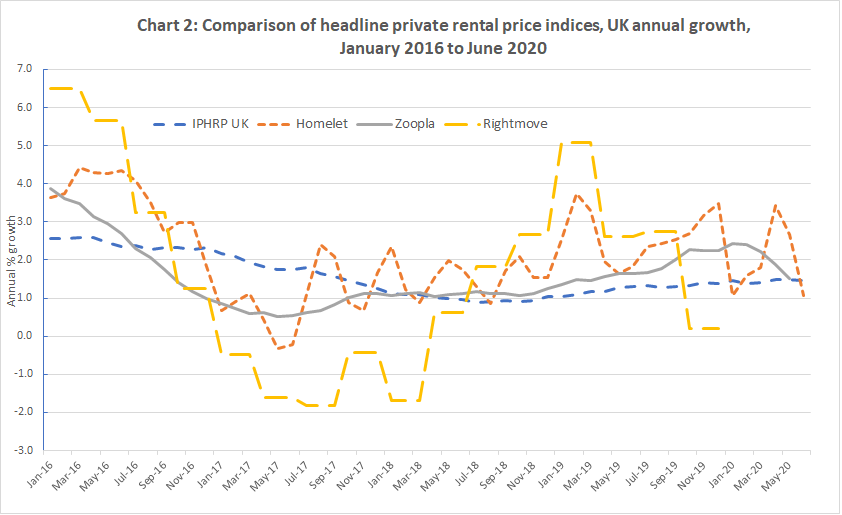
Due to the difference in how the various rental indices are measured, the IPHRP tends to lag the private measures by around 6 months – so using our analogy, it takes approximately 6 months for the overall temperature of the tub to reflect the heat of the hot water flow. As a stock-based measure, this is what we would expect IPHRP to show – landlords are unable to simply change the rental price for a long-term tenant, so it takes time to feed through. We would expect any potential impact of Covid-19 on the rental market to therefore take longer to materialise in IPHRP compared to the private ‘flow’ based measures.

Chris Jenkins is Assistant Deputy Director for Prices Division at the ONS
[1] The UK HPI is a joint publication by HM Land Registry, Registers of Scotland, Land and Property Services Northern Ireland, and the Office for National Statistics (ONS)