Inflation: How it’s reported and its impact on prices
Inflation is big news at the moment given the economic impact of the COVID-19 pandemic, the Ukraine conflict and the subsequent rise in the cost of living. When inflation is high, we all feel the impact as this reduces the amount of goods and services we can afford to purchase. As our latest numbers show a fall in the inflation rate, Chris Jenkins explains why it is important to understand this doesn’t necessarily mean a fall in prices.
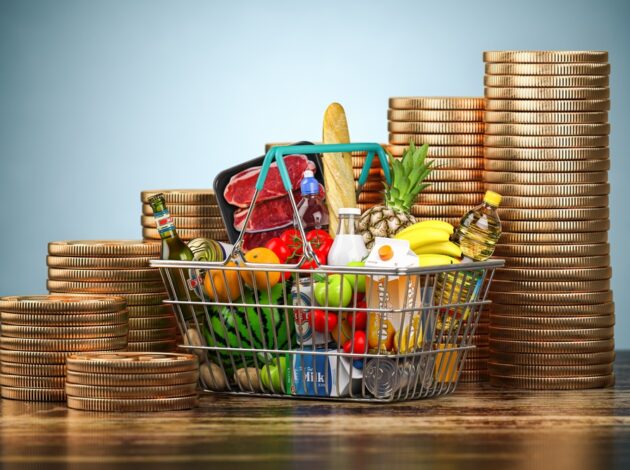
The rates of inflation produced by the ONS are well-established statistics that measure the average change in price of all goods and services. For consumer prices, this is measured by comparing the cost of a virtual basket of goods and services in the current month, with the same month a year earlier. So, for example, if the rate of inflation is 8%, it means, on average, prices are 8% higher than this time last year, so what would have cost you £100 now costs £108. This rate of inflation is the headline statistic we publish in our monthly consumer price inflation release.
Given the historically high levels of inflation we are seeing at the moment, we would naturally expect the inflation rate to fall in time. However, this doesn’t naturally equate to a fall in prices too. For example, a fall in the rate of inflation may be because prices of goods and services in the basket are increasing by a slower amount than the same period last year.
This is called a ‘base effect’, which we explained in a previous blog. So, if we see the CPI rate of inflation ‘fall’ from 11.1% to 10.7%, as we have seen this morning, this doesn’t mean prices are falling, just that they are now increasing at a slower rate but they are very much still going up.
We can only say prices are falling compared with last year when we see a negative inflation rate. History shows us negative inflation is rare, indeed it has only happened three times over the last thirty years
The overall virtual basket used to measure inflation is made up of many different goods and services. We collect roughly 180,000 prices monthly covering over 700 everyday goods and services. Obviously, within this basket, we are likely to see natural price fluctuations for prices of individual goods and services where they fall, as well as increase.
A recent example is for used cars, where 2021 and early 2022 saw record increases in used car prices which has now turned into price falls in recent months. Each component of the basket is ‘weighted’ to reflect their relative importance on household spending in the overall inflation rate. For this reason, we tend to notice price increases more for those goods or services which are essential for our daily lives, such as food, energy bills and fuel costs. Our monthly consumer price inflation bulletin provides further detail on the various components contributing to the inflation rate and how these are changing over time.
It’s important to understand how inflation is reported, and how changes in the rate of inflation relate to the prices of goods and services. With the rising cost of living, we are improving the level of data we publish to help our users understand the impact. We have also published a personal inflation calculator, which allows interested people to feed in their own levels of spending to see how inflation is affecting them.
So, while today’s fall in the rate of inflation is welcome, for now it merely shows that prices are rising more slowly, not actually falling.

Chris Jenkins is Assistant Deputy Director for Prices Division at the ONS